Shape palettes that approximate those used in GraphPad Prism. No unicode characters are used, only the default symbols available in R.
prism_shape_pal(palette = c("default", "filled", "complete"))Value
Returns a function which takes a single integer as its only argument and returns a character vector of integers which correspond to R plot pch symbols. See the examples below for usage.
Details
The default palette supports up to 9 values. It does not use
any symbols with a fill.
The filled palette supports up to 10 values. The first 5 symbols
have a fill.
The complete palette supports up to 14 values. Symbols 5 to 9
have a fill.
Examples
library(ggplot2)
## list all available shape palettes
ggprism_data$shape_palettes
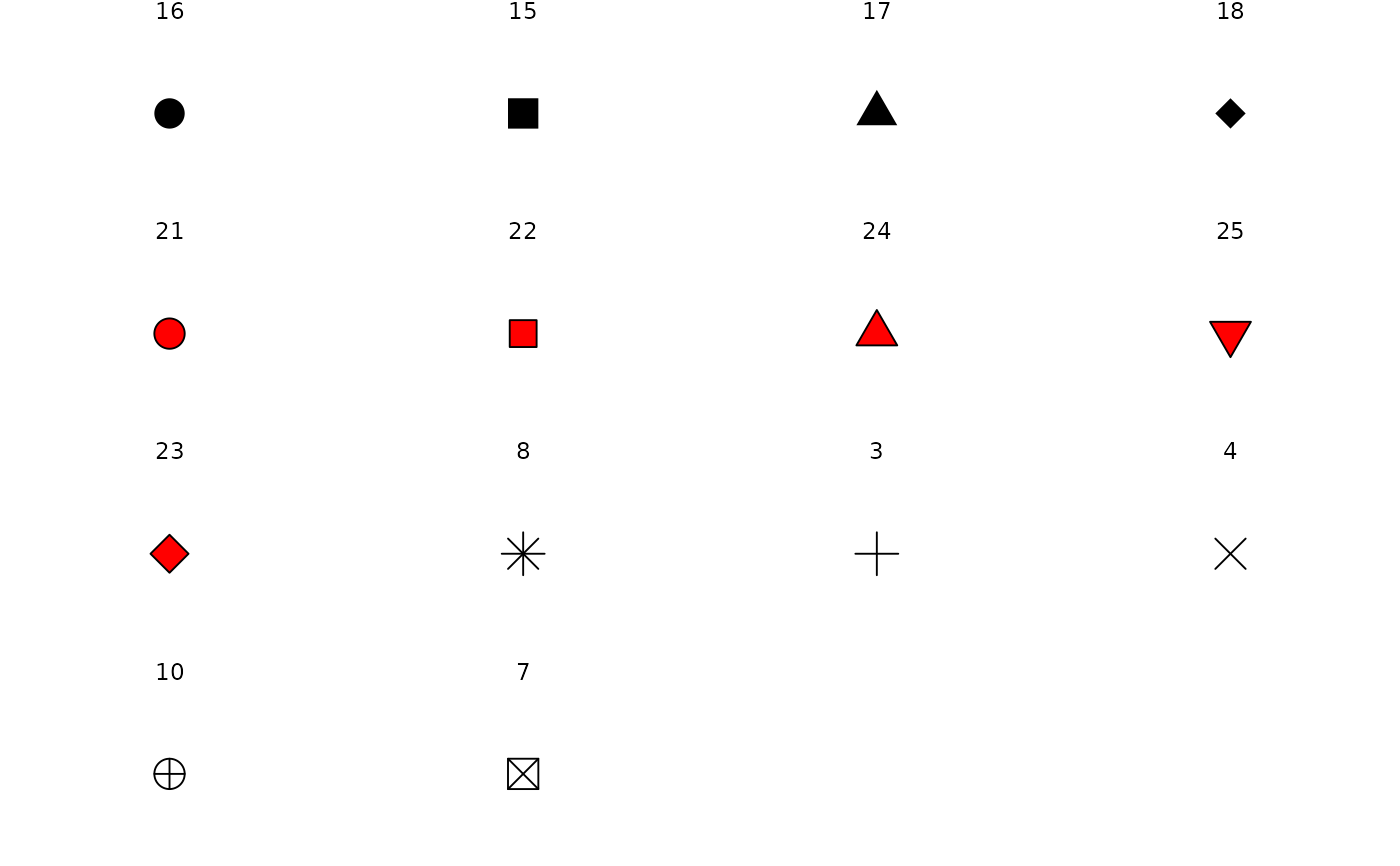
#> $complete
#> # A tibble: 14 × 2
#> name pch
#> <chr> <dbl>
#> 1 circle small 16
#> 2 square 15
#> 3 triangle 17
#> 4 diamond 18
#> 5 circle filled 21
#> 6 square filled 22
#> 7 triangle filled 24
#> 8 triangle down filled 25
#> 9 diamond filled 23
#> 10 asterisk 8
#> 11 plus 3
#> 12 cross 4
#> 13 circle plus 10
#> 14 square cross 7
#>
#> $default
#> # A tibble: 9 × 2
#> name pch
#> <chr> <dbl>
#> 1 circle small 16
#> 2 square 15
#> 3 triangle 17
#> 4 diamond 18
#> 5 asterisk 8
#> 6 plus 3
#> 7 cross 4
#> 8 circle plus 10
#> 9 square cross 7
#>
#> $filled
#> # A tibble: 10 × 2
#> name pch
#> <chr> <dbl>
#> 1 circle filled 21
#> 2 square filled 22
#> 3 triangle filled 24
#> 4 triangle down filled 25
#> 5 diamond filled 23
#> 6 asterisk 8
#> 7 plus 3
#> 8 cross 4
#> 9 circle plus 10
#> 10 square cross 7
#>
## select some shapes from a palette
prism_shape_pal(palette = "filled")(4)
#> [1] 21 22 24 25
## see all the shapes in a specific palette
# define a function for convenience
show_shapes <- function(palette) {
df_shapes <- ggprism_data$shape_palettes[[palette]][, -1]
df_shapes$pch_f <- factor(df_shapes$pch, levels = df_shapes$pch)
ggplot(df_shapes, aes(x = 0, y = 0, shape = pch)) +
geom_point(aes(shape = pch), size = 5, fill = 'red') +
scale_shape_identity() +
facet_wrap(~ pch_f) +
theme_void()
}
# show the shapes in the palette "complete"
show_shapes("complete")