This guide is like the standard guide_axis, but
with minor ticks.
Arguments
- title
A character string or expression indicating a title of guide. If
NULL, the title is not shown. By default (waiver()), the name of the scale object or the name specified inlabs()is used for the title.- check.overlap
silently remove overlapping labels, (recursively) prioritizing the first, last, and middle labels.
- angle
Compared to setting the angle in
theme()/element_text(), this also uses some heuristics to automatically pick thehjustandvjustthat you probably want. Can be one of the following:NULLto take the angles andhjust/vjustdirectly from the theme.waiver()to allow reasonable defaults in special cases.A number representing the text angle in degrees.
- n.dodge
The number of rows (for vertical axes) or columns (for horizontal axes) that should be used to render the labels. This is useful for displaying labels that would otherwise overlap.
- order
A positive
integerof length 1 that specifies the order of this guide among multiple guides. This controls in which order guides are merged if there are multiple guides for the same position. If 0 (default), the order is determined by a secret algorithm.- position
Where this guide should be drawn: one of top, bottom, left, or right.
Value
Returns a prism_minor guide class object.
Details
The number of minor ticks can be changed using the minor_breaks
argument. Control the length of minor ticks by setting
prism.ticks.length to a unit object using
theme, for example:
prism.ticks.length = unit(2, "pt"). The major tick lengths
are adjusted using the standard axis.ticks.length.
Examples
library(ggplot2)
## base plot
base <- ggplot(mtcars, aes(x = wt, y = mpg)) +
geom_point()
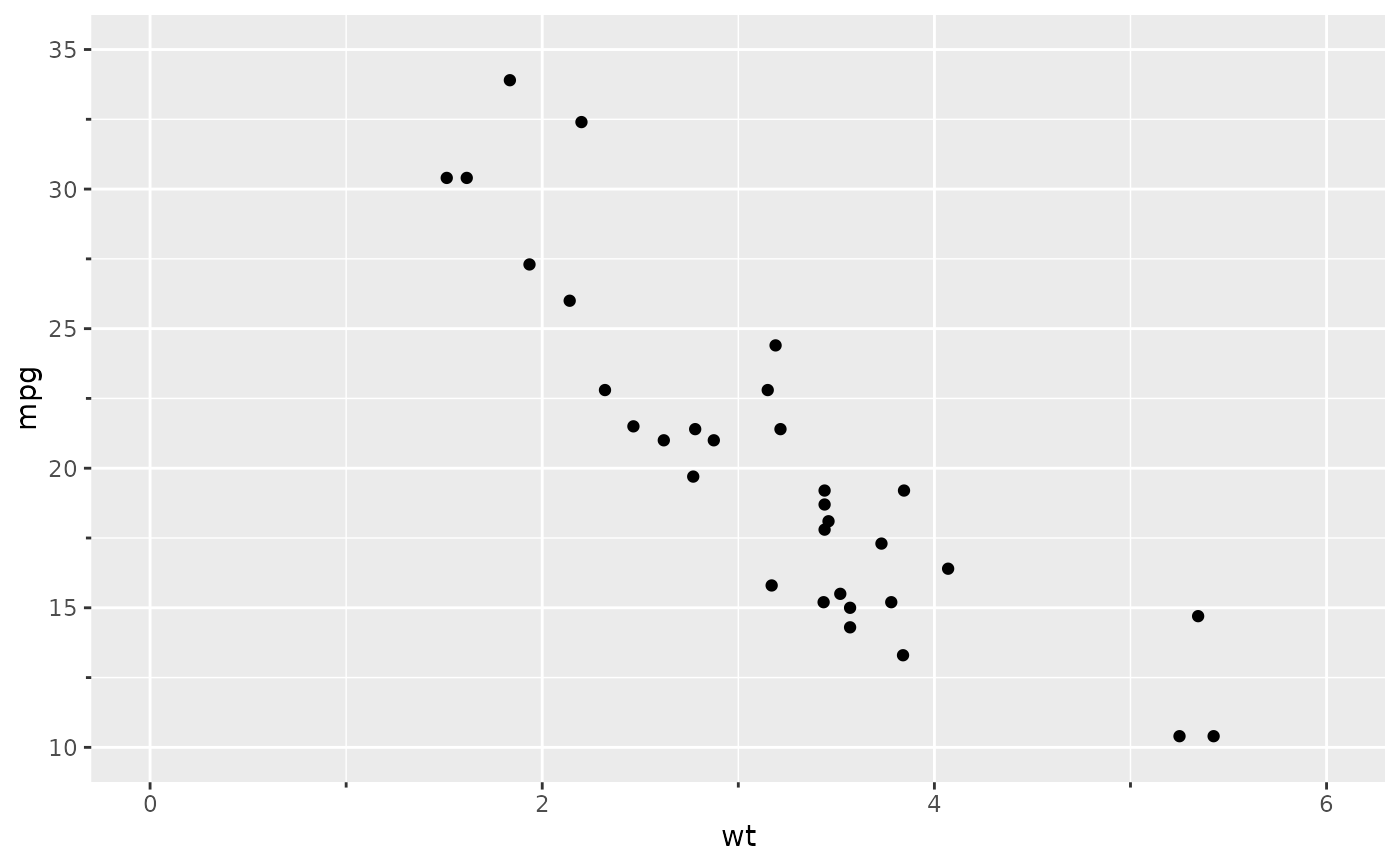
## add minor ticks to x and y axes
base +
scale_x_continuous(
limits = c(0, 6),
guide = "prism_minor"
) +
scale_y_continuous(
limits = c(10, 35),
guide = "prism_minor"
)
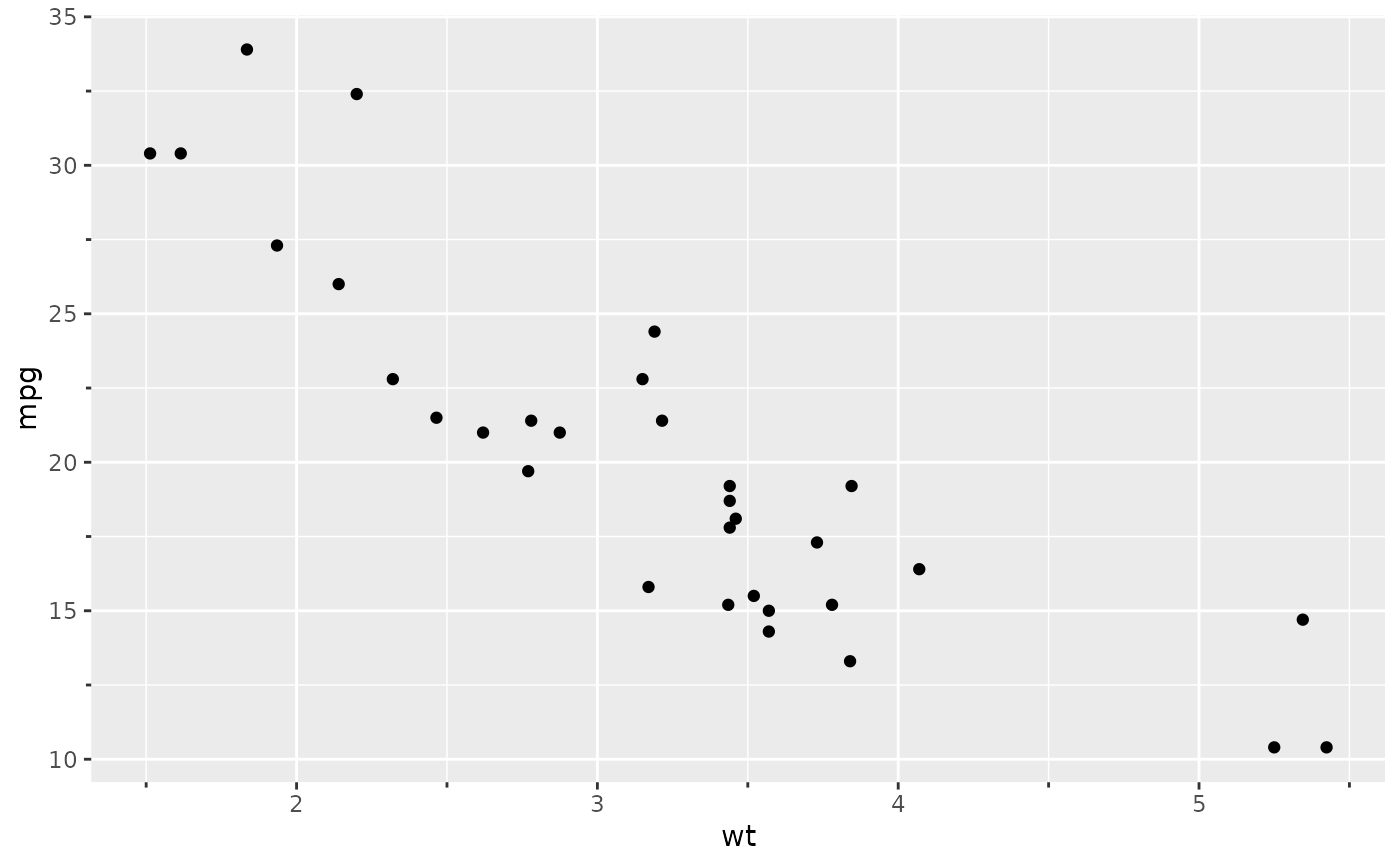
 ## you can also use the guides function to add minor ticks
base +
guides(x = "prism_minor", y = "prism_minor")
## you can also use the guides function to add minor ticks
base +
guides(x = "prism_minor", y = "prism_minor")
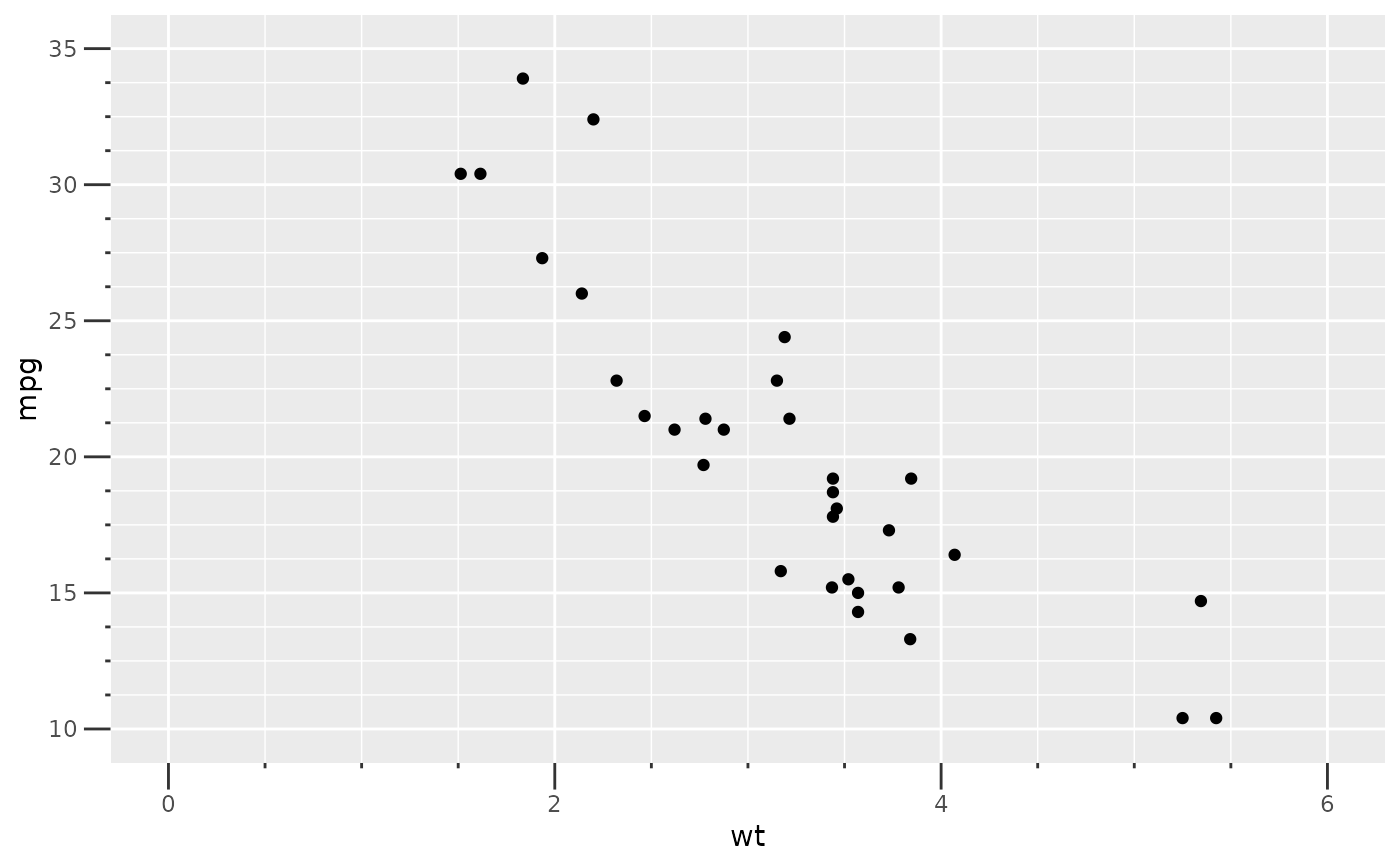
 ## adjust number of minor ticks by adjusting minor breaks
base +
scale_x_continuous(
limits = c(0, 6),
minor_breaks = seq(0, 6, 0.5),
guide = "prism_minor"
) +
scale_y_continuous(
limits = c(10, 35),
minor_breaks = seq(10, 35, 1.25),
guide = "prism_minor"
)
## adjust number of minor ticks by adjusting minor breaks
base +
scale_x_continuous(
limits = c(0, 6),
minor_breaks = seq(0, 6, 0.5),
guide = "prism_minor"
) +
scale_y_continuous(
limits = c(10, 35),
minor_breaks = seq(10, 35, 1.25),
guide = "prism_minor"
)
 ## adjust the length of major ticks with the usual axis.ticks.length element
base +
scale_x_continuous(
limits = c(0, 6),
minor_breaks = seq(0, 6, 0.5),
guide = "prism_minor"
) +
scale_y_continuous(
limits = c(10, 35),
minor_breaks = seq(10, 35, 1.25),
guide = "prism_minor"
) +
theme(
axis.ticks.length = unit(10, "pt")
)
## adjust the length of major ticks with the usual axis.ticks.length element
base +
scale_x_continuous(
limits = c(0, 6),
minor_breaks = seq(0, 6, 0.5),
guide = "prism_minor"
) +
scale_y_continuous(
limits = c(10, 35),
minor_breaks = seq(10, 35, 1.25),
guide = "prism_minor"
) +
theme(
axis.ticks.length = unit(10, "pt")
)
 ## adjust the length of minor ticks with a new prism.ticks.length element
base +
scale_x_continuous(
limits = c(0, 6),
minor_breaks = seq(0, 6, 0.5),
guide = "prism_minor"
) +
scale_y_continuous(
limits = c(10, 35),
minor_breaks = seq(10, 35, 1.25),
guide = "prism_minor"
) +
theme(
axis.ticks.length = unit(10, "pt"),
prism.ticks.length = unit(5, "pt")
)
## adjust the length of minor ticks with a new prism.ticks.length element
base +
scale_x_continuous(
limits = c(0, 6),
minor_breaks = seq(0, 6, 0.5),
guide = "prism_minor"
) +
scale_y_continuous(
limits = c(10, 35),
minor_breaks = seq(10, 35, 1.25),
guide = "prism_minor"
) +
theme(
axis.ticks.length = unit(10, "pt"),
prism.ticks.length = unit(5, "pt")
)
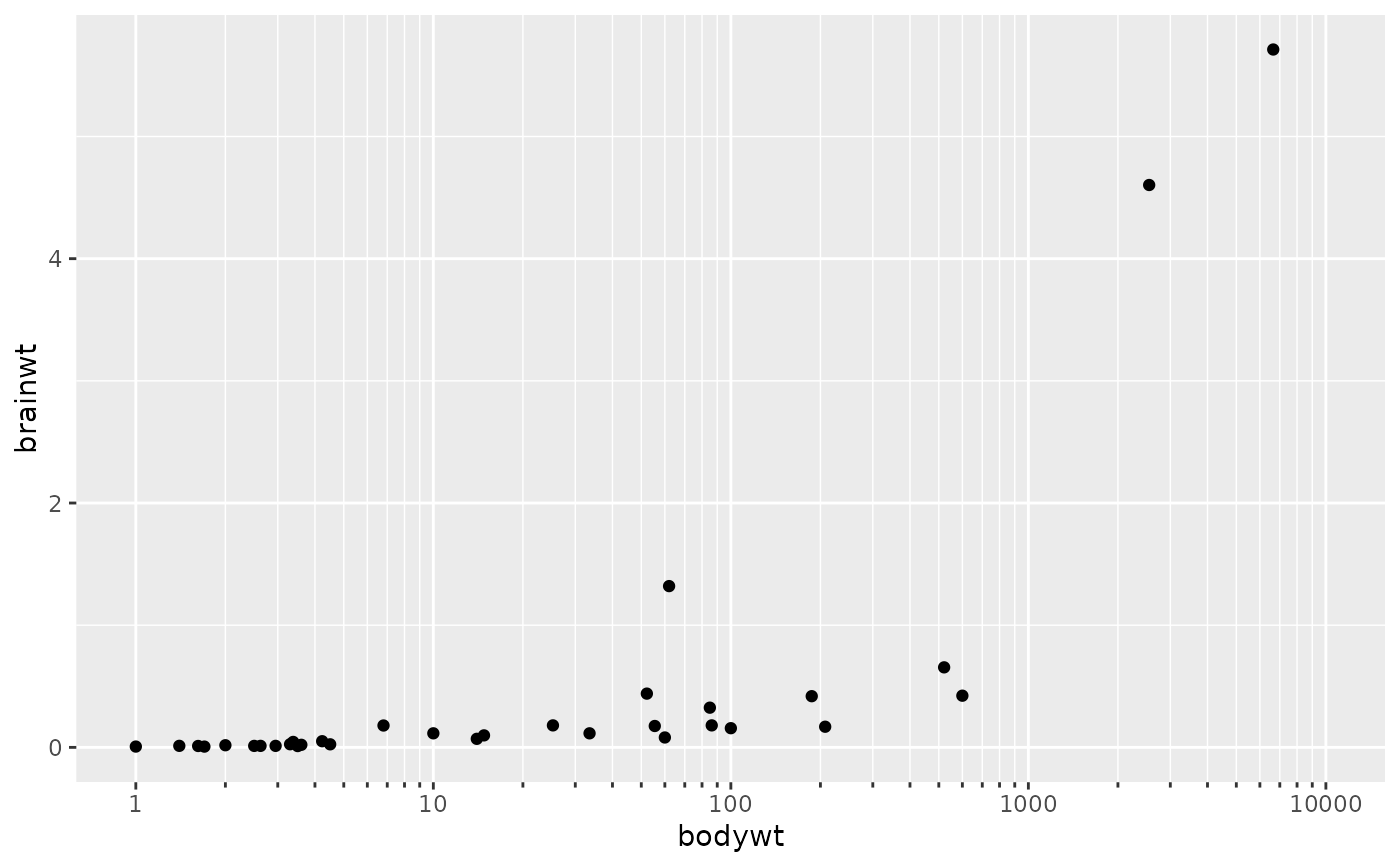
 ## to get log10 minor ticks just use a log10 scale and set the minor breaks
ggplot(msleep, aes(bodywt, brainwt)) +
geom_point(na.rm = TRUE) +
scale_x_log10(limits = c(1e0, 1e4),
minor_breaks = rep(1:9, 4)*(10^rep(0:3, each = 9)),
guide = "prism_minor")
## to get log10 minor ticks just use a log10 scale and set the minor breaks
ggplot(msleep, aes(bodywt, brainwt)) +
geom_point(na.rm = TRUE) +
scale_x_log10(limits = c(1e0, 1e4),
minor_breaks = rep(1:9, 4)*(10^rep(0:3, each = 9)),
guide = "prism_minor")
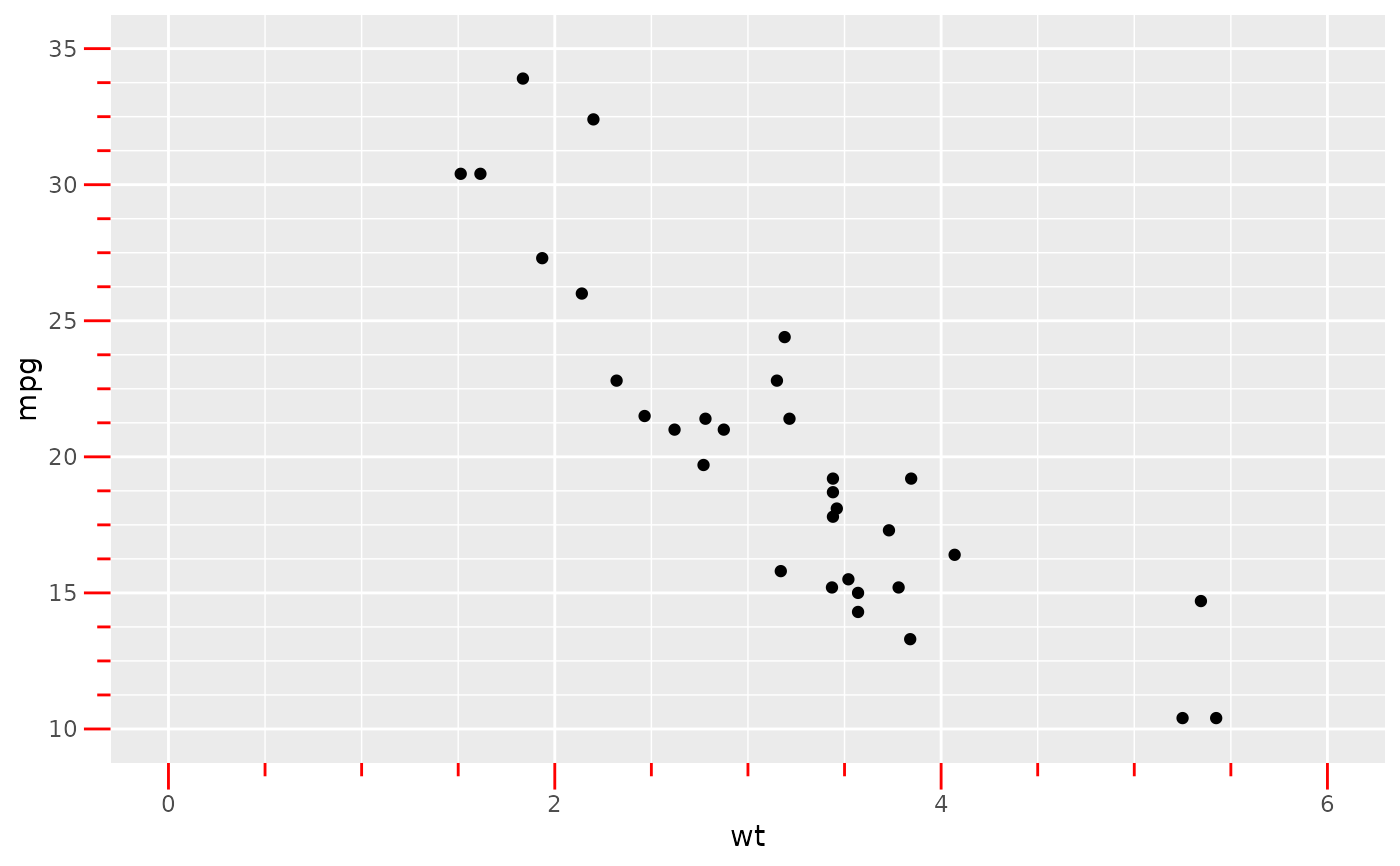
 ## change colour with the usual axis.ticks element
base +
scale_x_continuous(
limits = c(0, 6),
minor_breaks = seq(0, 6, 0.5),
guide = "prism_minor"
) +
scale_y_continuous(
limits = c(10, 35),
minor_breaks = seq(10, 35, 1.25),
guide = "prism_minor"
) +
theme(
axis.ticks.length = unit(10, "pt"),
prism.ticks.length = unit(5, "pt"),
axis.ticks = element_line(colour = "red")
)
## change colour with the usual axis.ticks element
base +
scale_x_continuous(
limits = c(0, 6),
minor_breaks = seq(0, 6, 0.5),
guide = "prism_minor"
) +
scale_y_continuous(
limits = c(10, 35),
minor_breaks = seq(10, 35, 1.25),
guide = "prism_minor"
) +
theme(
axis.ticks.length = unit(10, "pt"),
prism.ticks.length = unit(5, "pt"),
axis.ticks = element_line(colour = "red")
)