This guide turns the axis into brackets drawn around each axis label.
Arguments
- title
A character string or expression indicating a title of guide. If
NULL, the title is not shown. By default (waiver()), the name of the scale object or the name specified inlabs()is used for the title.- check.overlap
silently remove overlapping labels, (recursively) prioritizing the first, last, and middle labels.
- angle
Compared to setting the angle in
theme()/element_text(), this also uses some heuristics to automatically pick thehjustandvjustthat you probably want. Can be one of the following:NULLto take the angles andhjust/vjustdirectly from the theme.waiver()to allow reasonable defaults in special cases.A number representing the text angle in degrees.
- n.dodge
The number of rows (for vertical axes) or columns (for horizontal axes) that should be used to render the labels. This is useful for displaying labels that would otherwise overlap.
- order
A positive
integerof length 1 that specifies the order of this guide among multiple guides. This controls in which order guides are merged if there are multiple guides for the same position. If 0 (default), the order is determined by a secret algorithm.- position
Where this guide should be drawn: one of top, bottom, left, or right.
- width
numeric. Controls the width of the bracket. Try values between 0 and 1.- outside
logical. Default isTRUEand brackets point outwards. IfFALSEthe bracket crossbar is moved so the ticks appear to point inwards towards the plotting area.
Value
Returns a prism_bracket guide class object.
Details
The number of brackets can be adjusted using the breaks
argument in scale_(x|y)_continuous() or scale_(x|y)_discrete().
Examples
library(ggplot2)
## base plot
base <- ggplot(mpg, aes(x = as.factor(cyl), y = hwy)) +
geom_jitter(width = 0.2) +
theme(axis.line = element_line(colour = "black"))
## use brackets on x axis
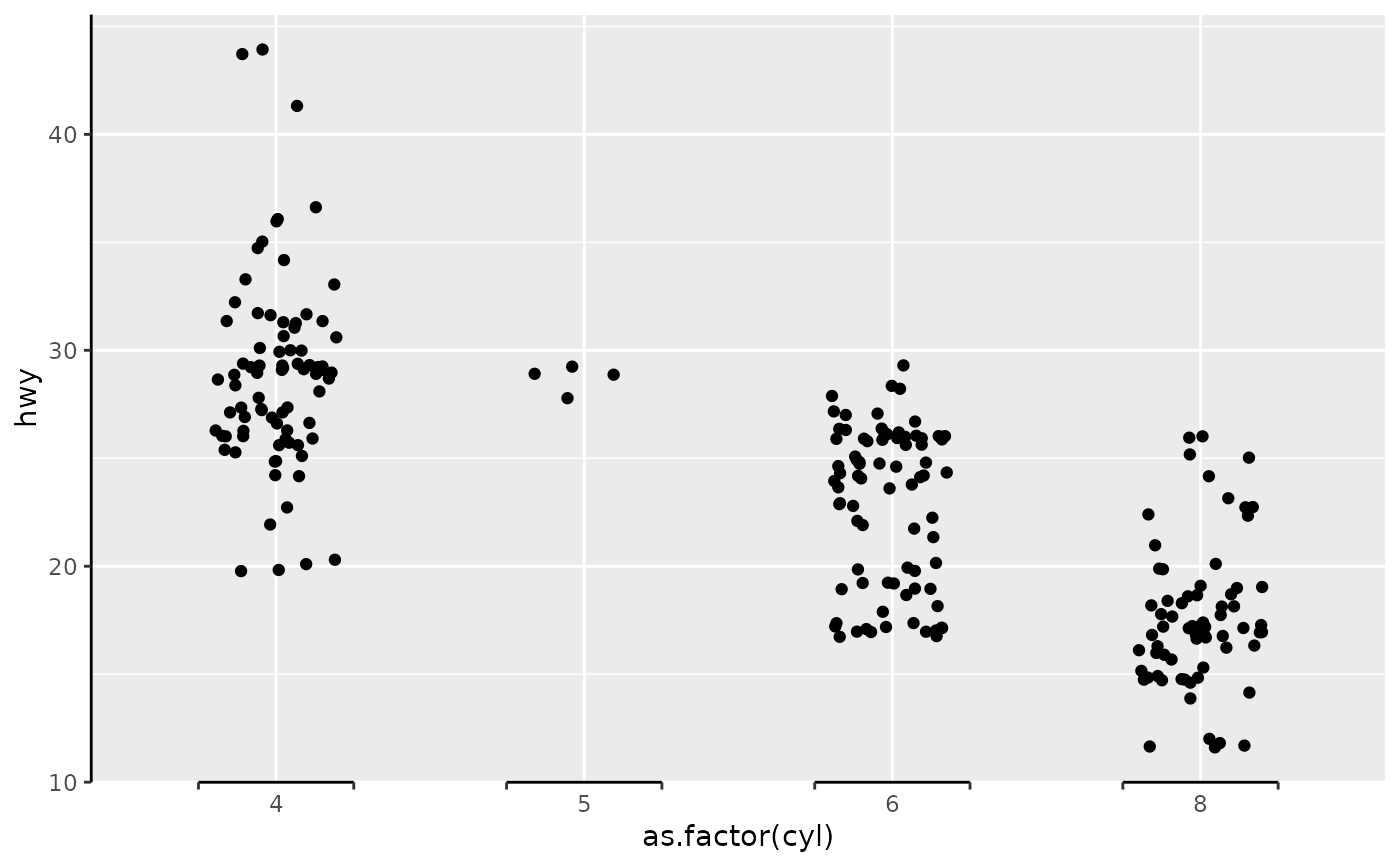
# if not specified, the width of the brackets is guessed
base + scale_x_discrete(guide = "prism_bracket")
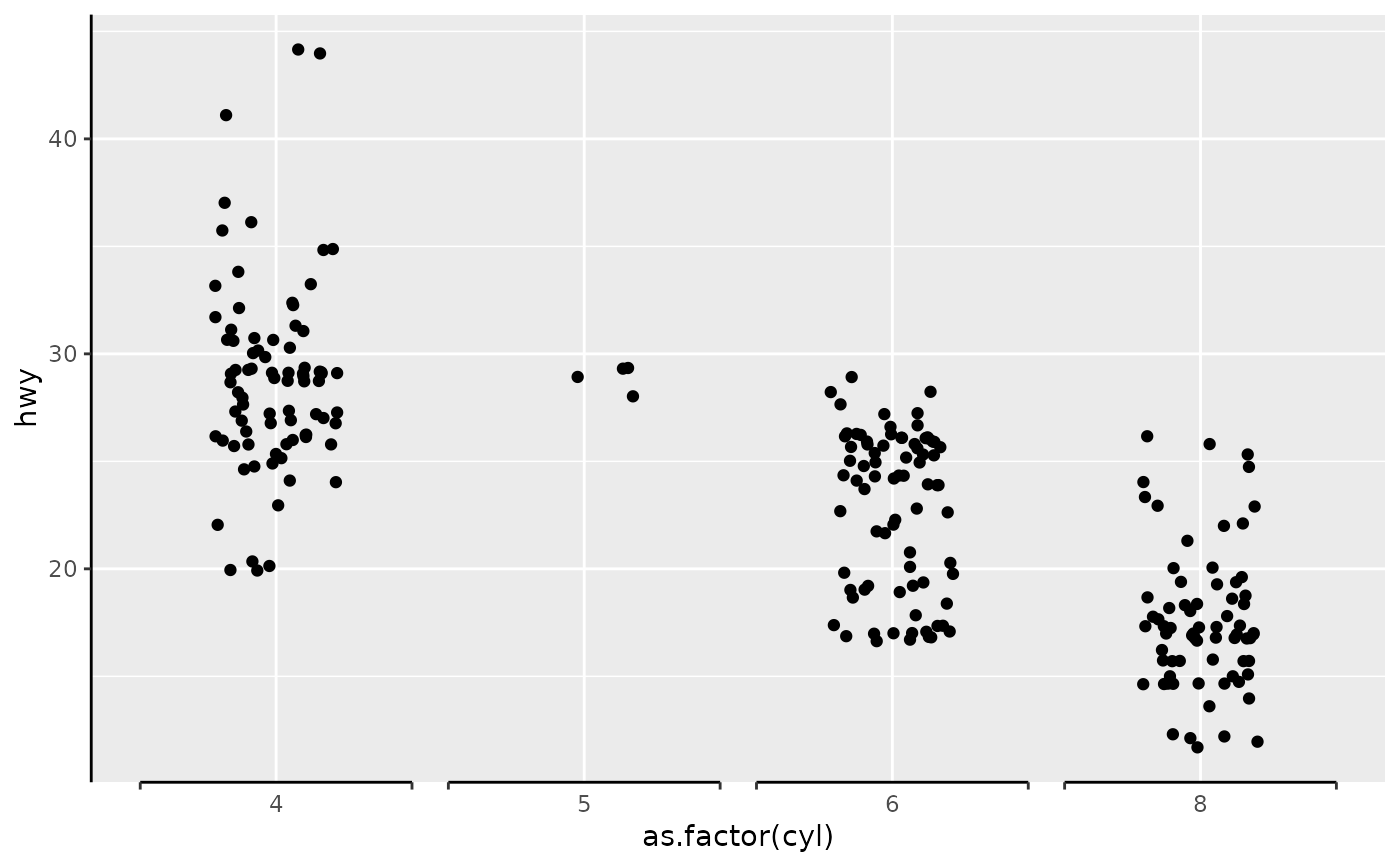 # you can add brackets using the guide function as well
base + guides(x = "prism_bracket")
# you can add brackets using the guide function as well
base + guides(x = "prism_bracket")
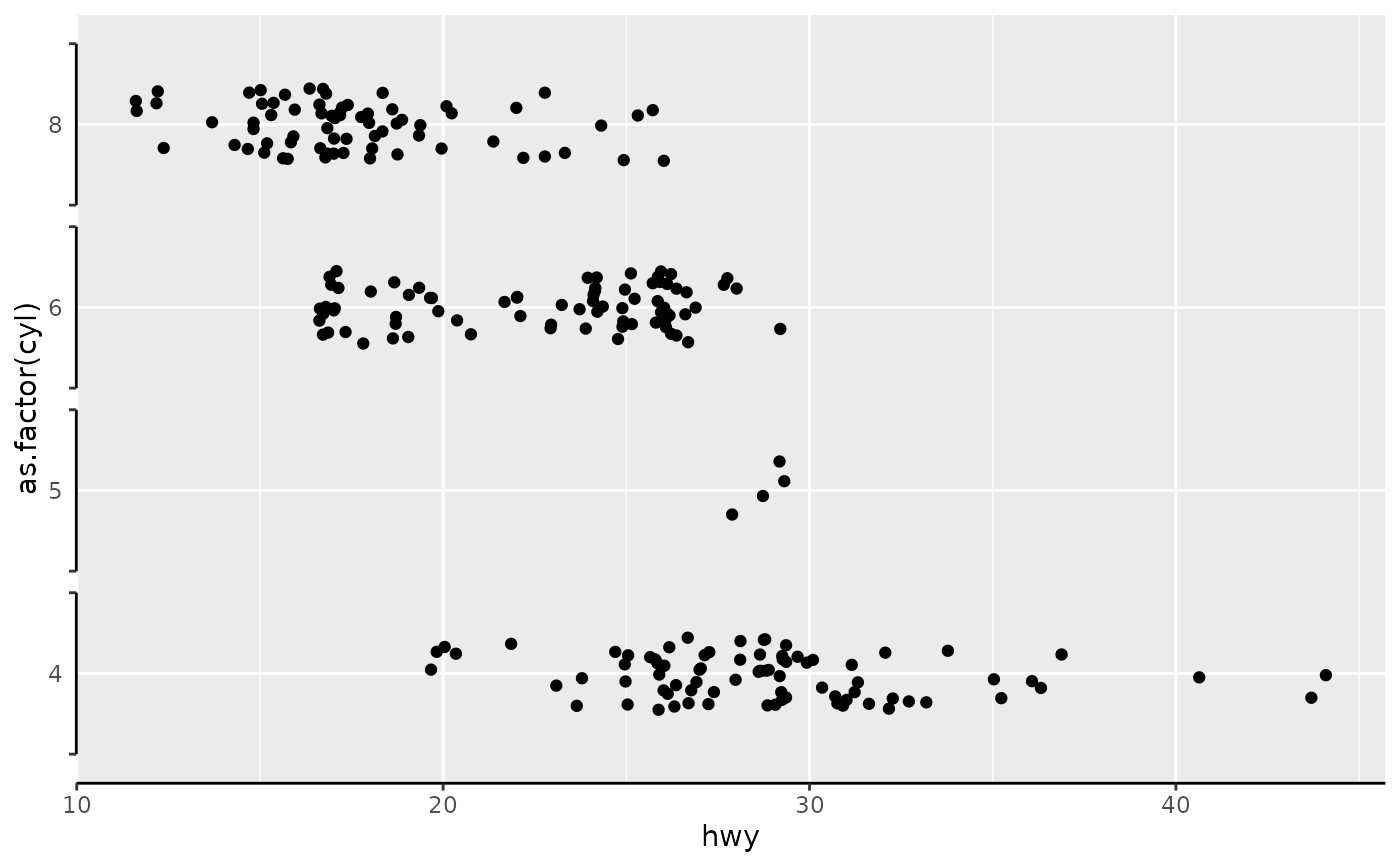
 ## works with coord_flip
base + scale_x_discrete(guide = "prism_bracket") +
coord_flip()
## works with coord_flip
base + scale_x_discrete(guide = "prism_bracket") +
coord_flip()
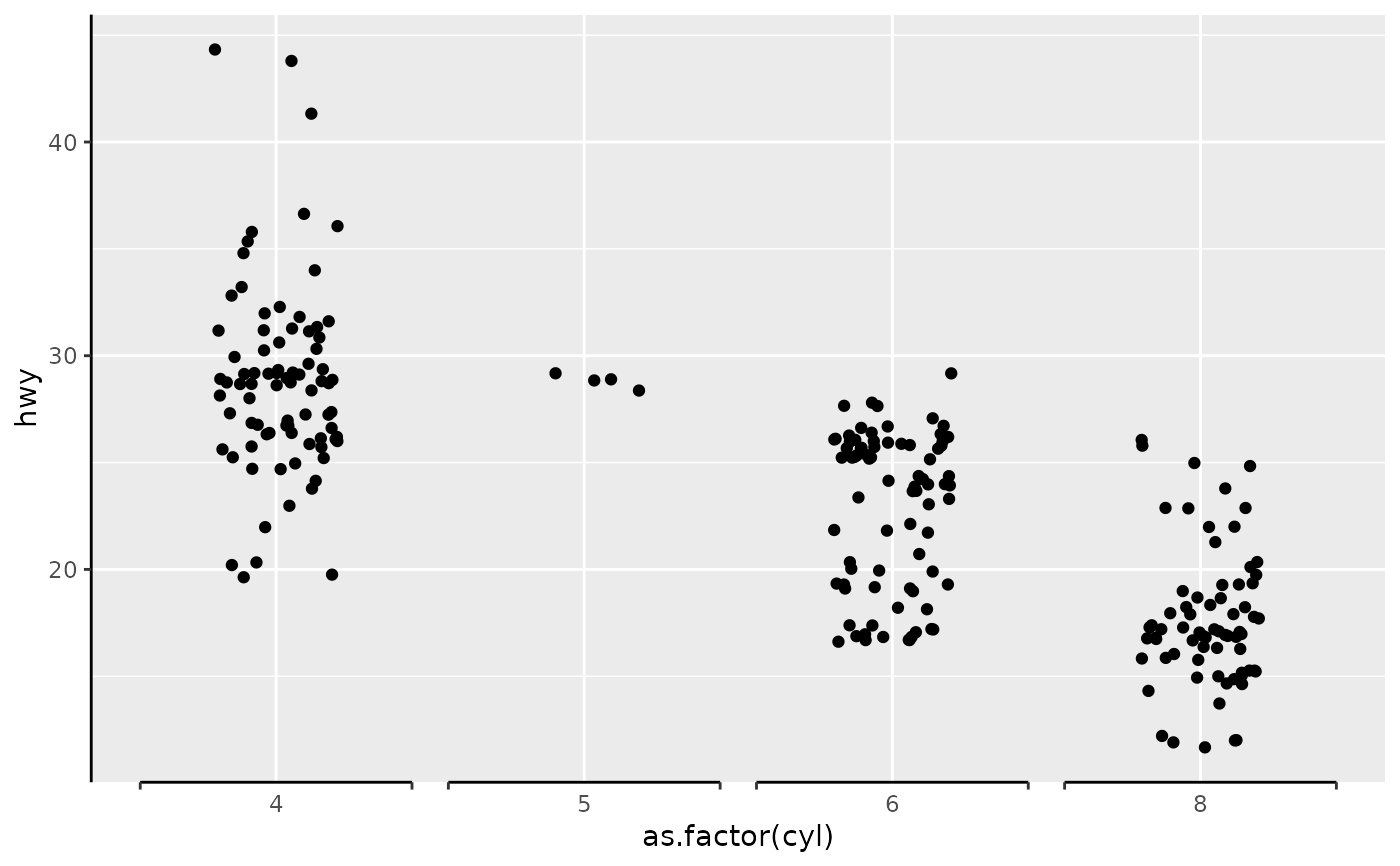
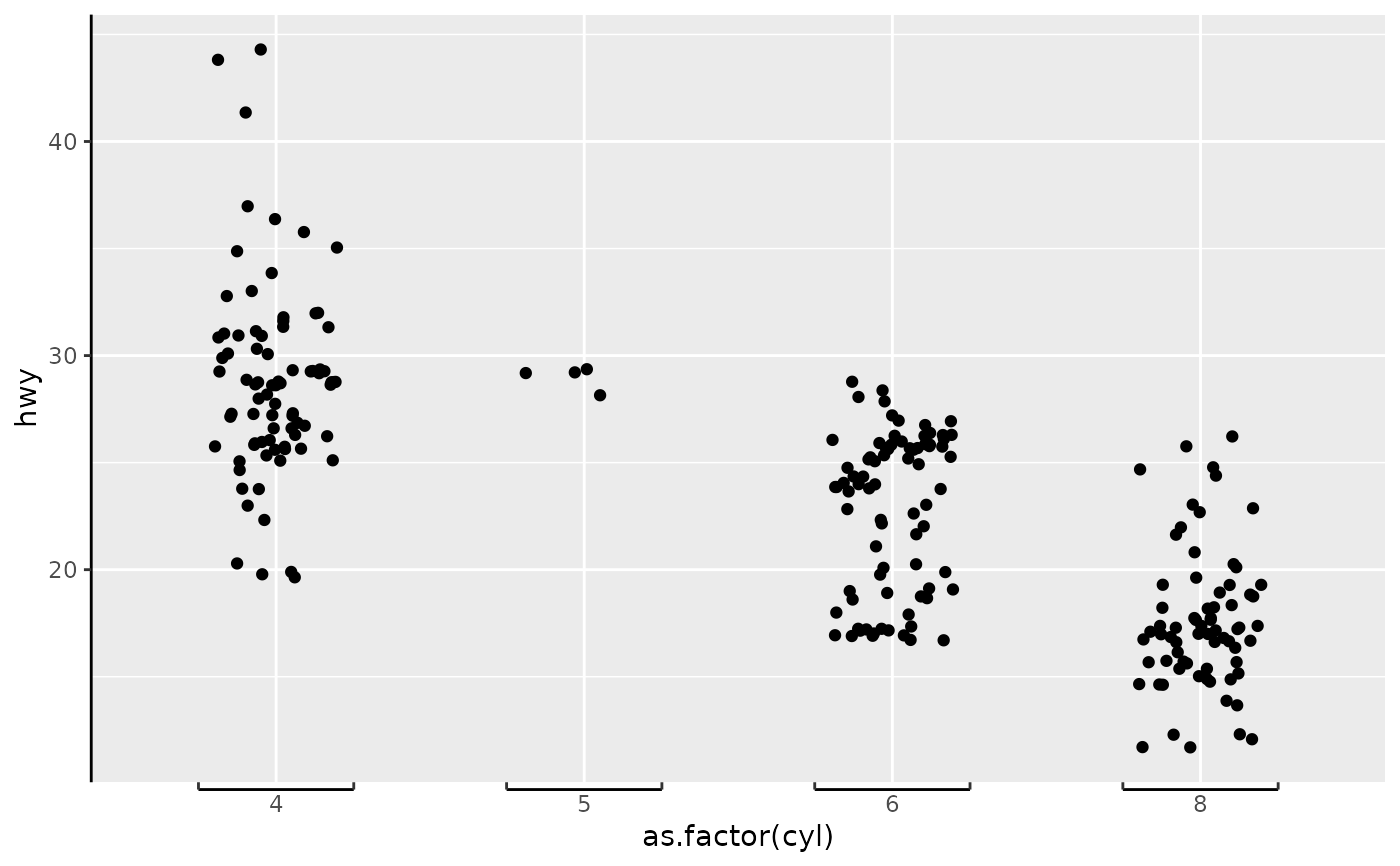
 ## adjust bracket width
base + scale_x_discrete(guide = guide_prism_bracket(width = 0.12))
## adjust bracket width
base + scale_x_discrete(guide = guide_prism_bracket(width = 0.12))
 ## make brackets point inward
base + scale_x_discrete(guide = guide_prism_bracket(width = 0.12, outside = FALSE))
## make brackets point inward
base + scale_x_discrete(guide = guide_prism_bracket(width = 0.12, outside = FALSE))
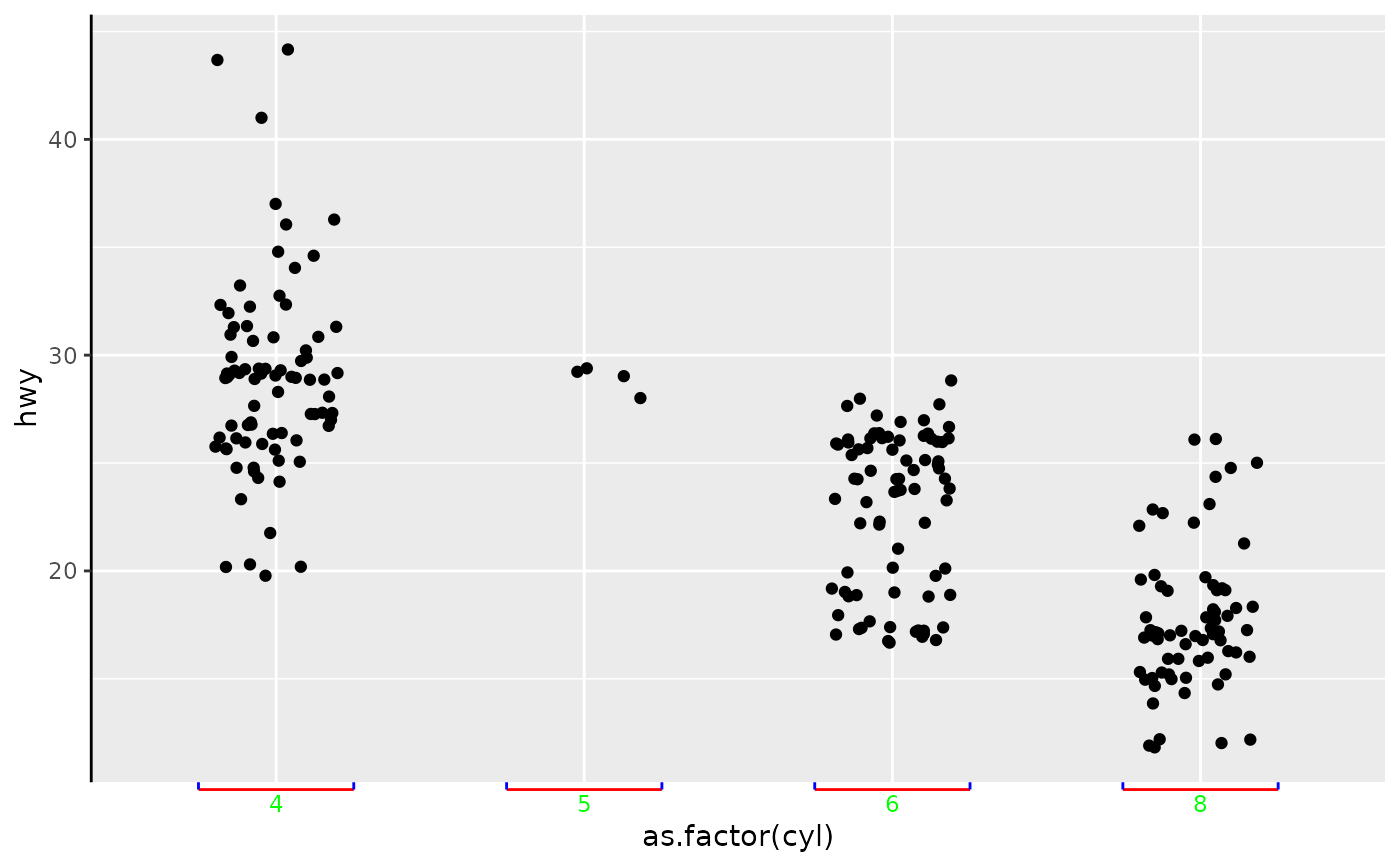
 ## change colour with the usual axis.line, axis.ticks, axis.text elements
base + scale_x_discrete(guide = guide_prism_bracket(width = 0.12, outside = FALSE)) +
theme(axis.line.x = element_line(colour = "red"),
axis.ticks.x = element_line(colour = "blue"),
axis.text.x = element_text(colour = "green"))
## change colour with the usual axis.line, axis.ticks, axis.text elements
base + scale_x_discrete(guide = guide_prism_bracket(width = 0.12, outside = FALSE)) +
theme(axis.line.x = element_line(colour = "red"),
axis.ticks.x = element_line(colour = "blue"),
axis.text.x = element_text(colour = "green"))