This is an annotation function to add tick marks (major, minor, or both) to
a ggplot. Clipping must be turned off if the ticks are to appear outside the
plotting area, for example with: coord_cartesian(clip = "off").
annotation_ticks(
  sides = "b",
  type = "both",
  outside = FALSE,
  tick.length = unit(4.8, "pt"),
  minor.length = unit(2.4, "pt"),
  linewidth = 0.6,
  colour = "black",
  color = NULL,
  linetype = 1,
  lineend = "butt",
  alpha = 1,
  data = data.frame(x = NA)
)
Source
The code is a slightly modified version of the answer to this
Stack Overflow question 58485334,
which is itself a refactored version of this
annotation_ticks()
function.
Arguments
- sides
string. Indicates which sides of the plot should ticks appear. Can be any of"trbl", for top, right, bottom, left.- type
string. Types of ticks that appear. One of"major","minor", or"both". Control number of ticks by controlling thebreaksandminor_breaksarguments in the various ggplot2scale_(x|y)_functions.- outside
logical. Should the ticks point outside of the plotting area? IfTRUEclipping must be turned off.- tick.length
a
unitobject specifying the length of major ticks.- minor.length
a
unitobject specifying the length of minor ticks.- linewidth
numeric. Linewidth of ticks.- colour, color
string. Colour of ticks.- linetype
stringornumeric. Linetype of tick marks.- lineend
string. Lineend of ticks. One of"square"(default),"butt", or"round".- alpha
numeric. Transparency of ticks.- data
data.frame. Use this argument to control the appearance of ticks on different facets. Pass a data.frame containing the levels from the faceting variable you want to annotate specifically. See question 20128582 on Stack Overflow for an example.
Value
Returns a layer ggproto object with geom = GeomTicks.
Examples
## Generally it is better to use the guide_prism_minor function.
## However annotation_ticks is useful in a few specific situations.
library(ggplot2)
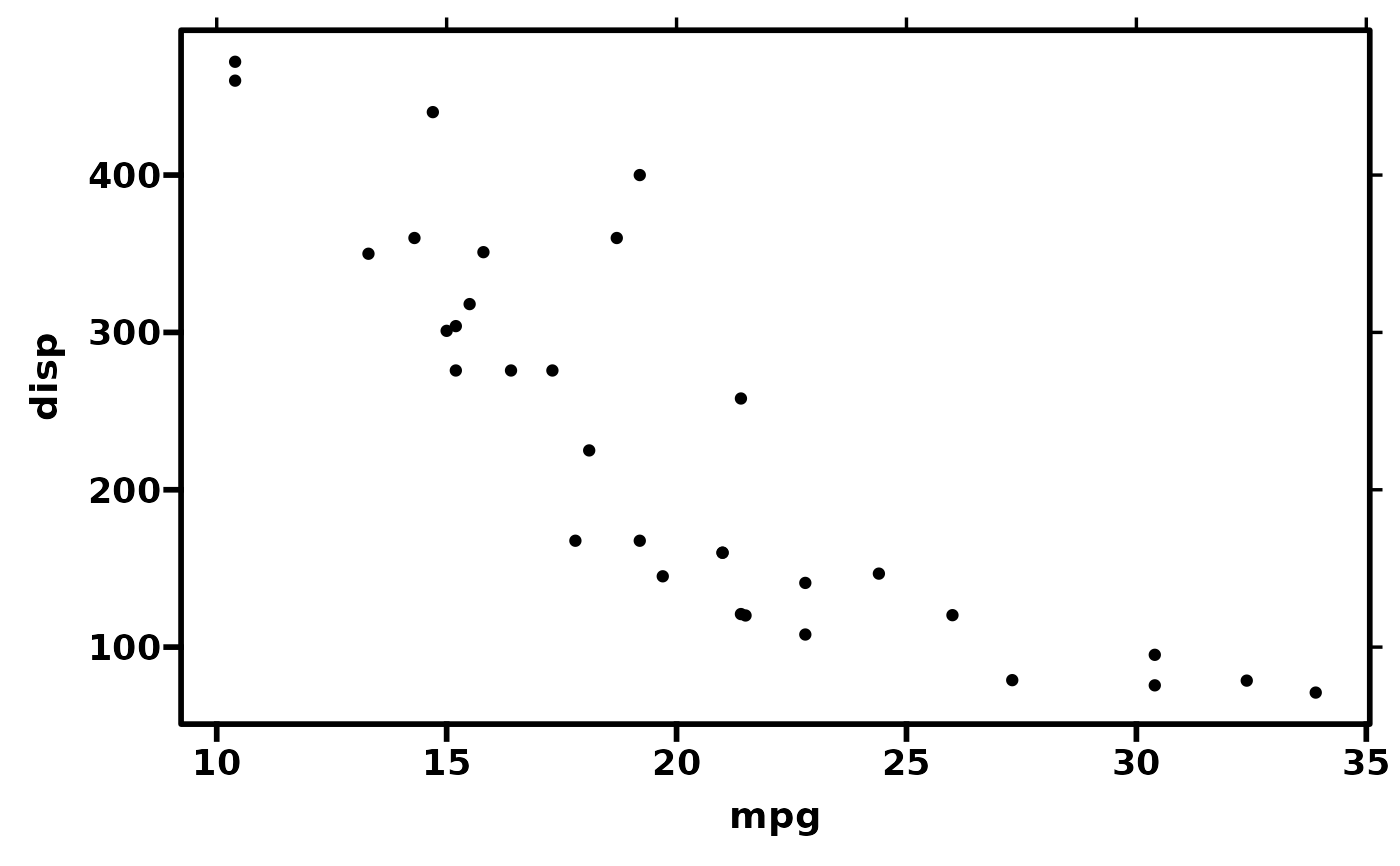
## easily put ticks without labels around a plot with a border
ggplot(mtcars, aes(x = mpg, y = disp)) +
geom_point() +
theme_prism(border = TRUE) +
coord_cartesian(clip = "off") +
annotation_ticks(sides = "tr", type = "major", outside = TRUE) +
theme(plot.margin = unit(c(4, 4, 4, 4), "mm"))
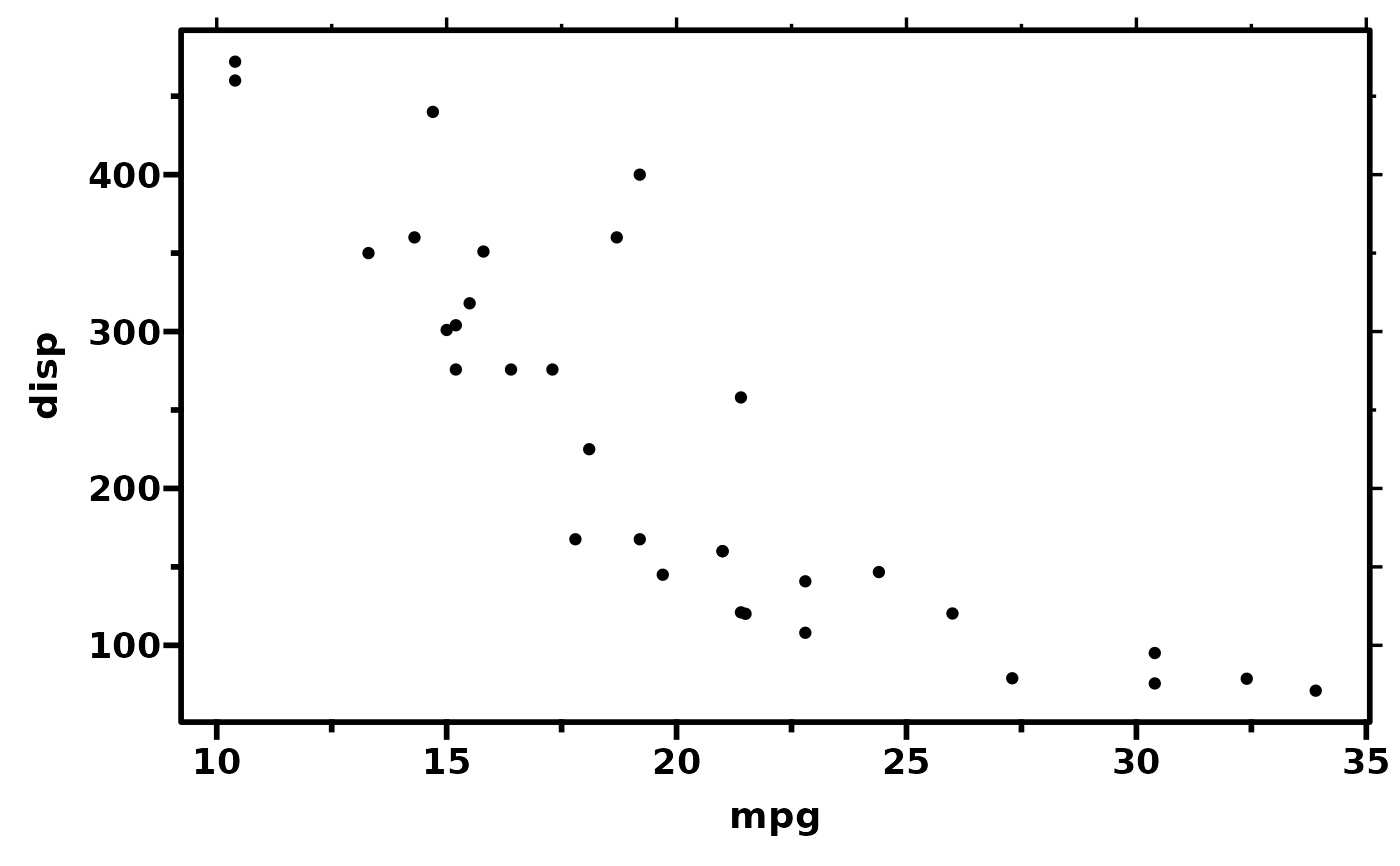
 # the same but with minor ticks as well
ggplot(mtcars, aes(x = mpg, y = disp)) +
geom_point() +
scale_x_continuous(guide = "prism_minor") +
scale_y_continuous(guide = "prism_minor") +
theme_prism(border = TRUE) +
coord_cartesian(clip = "off") +
annotation_ticks(sides = "tr", type = "both", outside = TRUE) +
theme(plot.margin = unit(c(4, 4, 4, 4), "mm"))
#> Warning: The S3 guide system was deprecated in ggplot2 3.5.0.
#> ℹ It has been replaced by a ggproto system that can be extended.
# the same but with minor ticks as well
ggplot(mtcars, aes(x = mpg, y = disp)) +
geom_point() +
scale_x_continuous(guide = "prism_minor") +
scale_y_continuous(guide = "prism_minor") +
theme_prism(border = TRUE) +
coord_cartesian(clip = "off") +
annotation_ticks(sides = "tr", type = "both", outside = TRUE) +
theme(plot.margin = unit(c(4, 4, 4, 4), "mm"))
#> Warning: The S3 guide system was deprecated in ggplot2 3.5.0.
#> ℹ It has been replaced by a ggproto system that can be extended.
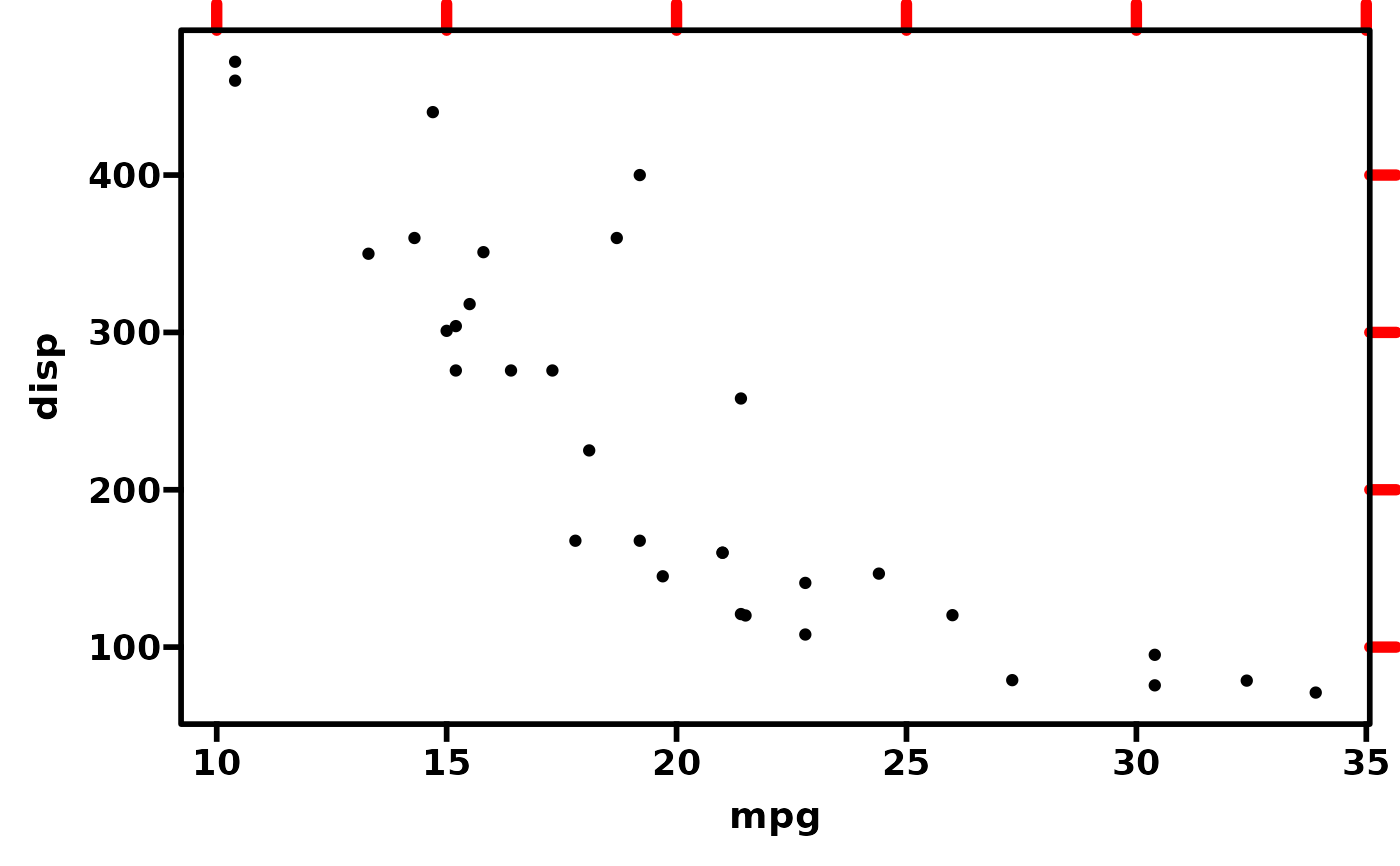
 # you can adjust the appearance of annotation_ticks
ggplot(mtcars, aes(x = mpg, y = disp)) +
geom_point() +
theme_prism(border = TRUE) +
coord_cartesian(clip = "off") +
annotation_ticks(
sides = "tr",
type = "major",
outside = TRUE,
tick.length = unit(10, "pt"),
colour = "red",
linewidth = 2,
linetype = "dashed",
lineend = "round"
) +
theme(plot.margin = unit(c(4, 4, 4, 4), "mm"))
# you can adjust the appearance of annotation_ticks
ggplot(mtcars, aes(x = mpg, y = disp)) +
geom_point() +
theme_prism(border = TRUE) +
coord_cartesian(clip = "off") +
annotation_ticks(
sides = "tr",
type = "major",
outside = TRUE,
tick.length = unit(10, "pt"),
colour = "red",
linewidth = 2,
linetype = "dashed",
lineend = "round"
) +
theme(plot.margin = unit(c(4, 4, 4, 4), "mm"))
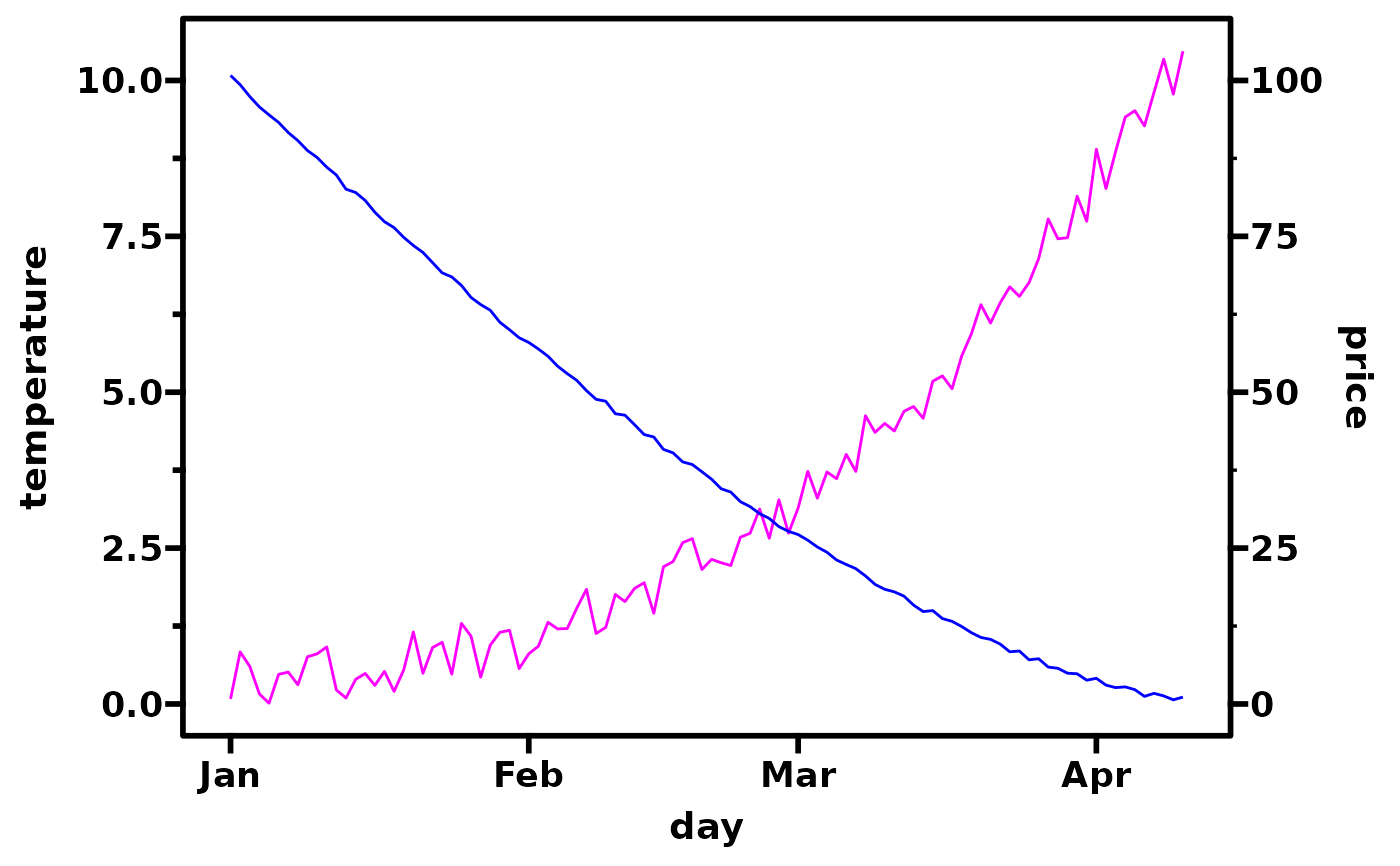
 ## Unfortunately, due to the way they work, secondary axes don't always play
## well with the minor tick axes guides in this package.
## So we can use annotation_ticks instead.
sample.data <- data.frame(
day = as.Date("2019-01-01") + 0:99,
temperature = runif(100) + seq(1, 100)^2.5 / 10000,
price = runif(100) + seq(100, 1)^1.5 / 10
)
# sample graph with secondary axis
ggplot(sample.data, aes(x = day)) +
geom_line(aes(y = temperature), colour = "magenta") +
geom_line(aes(y = price / 10), colour = "blue") +
scale_y_continuous(sec.axis = sec_axis(~. * 10, name = "price")) +
theme_prism(border = TRUE) +
coord_cartesian(clip = "off")
## Unfortunately, due to the way they work, secondary axes don't always play
## well with the minor tick axes guides in this package.
## So we can use annotation_ticks instead.
sample.data <- data.frame(
day = as.Date("2019-01-01") + 0:99,
temperature = runif(100) + seq(1, 100)^2.5 / 10000,
price = runif(100) + seq(100, 1)^1.5 / 10
)
# sample graph with secondary axis
ggplot(sample.data, aes(x = day)) +
geom_line(aes(y = temperature), colour = "magenta") +
geom_line(aes(y = price / 10), colour = "blue") +
scale_y_continuous(sec.axis = sec_axis(~. * 10, name = "price")) +
theme_prism(border = TRUE) +
coord_cartesian(clip = "off")
 # guide_prism_minor only works with the main axis in this case
ggplot(sample.data, aes(x = day)) +
geom_line(aes(y = temperature), colour = "magenta") +
geom_line(aes(y = price / 10), colour = "blue") +
scale_y_continuous(
sec.axis = sec_axis(~. * 10, name = "price"),
guide = "prism_minor"
) +
theme_prism(border = TRUE) +
coord_cartesian(clip = "off")
# guide_prism_minor only works with the main axis in this case
ggplot(sample.data, aes(x = day)) +
geom_line(aes(y = temperature), colour = "magenta") +
geom_line(aes(y = price / 10), colour = "blue") +
scale_y_continuous(
sec.axis = sec_axis(~. * 10, name = "price"),
guide = "prism_minor"
) +
theme_prism(border = TRUE) +
coord_cartesian(clip = "off")
 # we use annotation_ticks to draw the minor ticks on the secondary axis
ggplot(sample.data, aes(x = day)) +
geom_line(aes(y = temperature), colour = "magenta") +
geom_line(aes(y = price / 10), colour = "blue") +
scale_y_continuous(
sec.axis = sec_axis(~. * 10, name = "price"),
guide = "prism_minor"
) +
theme_prism(border = TRUE) +
coord_cartesian(clip = "off") +
annotation_ticks(sides = "r", type = "minor", outside = TRUE)
# we use annotation_ticks to draw the minor ticks on the secondary axis
ggplot(sample.data, aes(x = day)) +
geom_line(aes(y = temperature), colour = "magenta") +
geom_line(aes(y = price / 10), colour = "blue") +
scale_y_continuous(
sec.axis = sec_axis(~. * 10, name = "price"),
guide = "prism_minor"
) +
theme_prism(border = TRUE) +
coord_cartesian(clip = "off") +
annotation_ticks(sides = "r", type = "minor", outside = TRUE)