Add p-values with or without brackets to a ggplot.
See here or the examples section below for examples of how to use.
add_pvalue is a heavily re-written version of
stat_pvalue_manual from
kassambara/ggpubr. Any examples
using stat_pvalue_manual found on
Datanovia
should also work with add_pvalue with minimal to no alterations.
add_pvalue(
  data,
  label = NULL,
  xmin = "group1",
  xmax = "group2",
  x = NULL,
  y.position = "y.position",
  parse = FALSE,
  label.size = 3.2,
  colour = NULL,
  color = NULL,
  tip.length = 0.03,
  bracket.size = 0.6,
  bracket.colour = NULL,
  bracket.color = NULL,
  bracket.shorten = 0,
  bracket.nudge.y = 0,
  step.increase = 0,
  step.group.by = NULL,
  remove.bracket = FALSE,
  coord.flip = FALSE,
  position = "identity",
  ...
)
Arguments
- data
A
data.framewith the statistics to plot. Default format has the following columns:group1 | group2 | p.adj | y.position | etc.group1andgroup2are the two groups that were compared.p.adjis the adjusted p-value.y.positionis the y coordinate that specifies where on the plot the p-value should go. The column names can differ from the default as long as their are specified when calling the function.- label
string. Name of column indatathat contains the text to plot (e.g.label = "p.adj"). Can also be an expression that can be formatted byglue(e.g.label = "p = {p.adj}").- xmin
string. Name of column indatathat contains the position of the left side of the brackets. Default is"group1".- xmax
Optional.
string. Name of column indatathat contains the position of the right side of the brackets. Default is"group2". IfNULL, the p-values are plotted as text only.- x
stringornumeric. x coordinate of the p-value text. Only use when plotting p-value as text only (no brackets).- y.position
string. Name of column indatacontaining the y coordinates (numeric) of each p-value to be plotted. Can also be a single number to plot all p-values at the same height or anumericvector that will overridedata.- parse
logical. Default isFALSE. IfTRUEthe text labels will be parsed into expressions and displayed as described in grDevices::plotmath.- label.size
numeric. Size of text. Default is3.2.- colour, color
string. Colour of text. Default is"black".- tip.length
numericvector. Length of bracket tips. Default is0.03, use0to remove tips.- bracket.size
numeric. Line width of bracket. Default is0.6.- bracket.colour, bracket.color
string. Colour of bracket. Default isNULLwhich causes brackets to inherit the colour of the text.- bracket.shorten
numeric. Shortens the brackets slightly to allow them to be plotted side-by-side at the same y position.- bracket.nudge.y
numeric. Changes the y position of p-values. Useful for slightly adjusting p-values if the text is cut off.- step.increase
numeric. Changes the space between brackets.- step.group.by
string. Variable to group brackets by.- remove.bracket
logical. IfTRUEall brackets are removed and p-value is shown as text only.- coord.flip
logical. This argument is deprecated.- position
stringor call to position function such asposition_dodge. Typically used for adjusting x position of p-values to be in line with dodged data.- ...
Additional aesthetics or arguments passed to
layer. See below for allowed values.
Value
Returns a ggplot2 Layer object that can be added to a plot.
Allowed ... values
add_pvalue understands the following additional aesthetics or arguments:
fontfacestring. Fontface of text (e.g."bold").fontfamilystring. Fontfamily of text (e.g."Arial").hjustnumeric. Horizontal justification of text.vjustnumeric. Vertical justification of text.alphanumeric. Transparency of text and/or brackets.linetypestringornumeric. Linetype of brackets (e.g."dashed").lineendstring. Lineend of brackets (e.g."butt").na.rmlogical. IfFALSE(default), removes missing values with a warning. IfTRUEsilently removes missing values.show.legendlogical. Should this layer be included in the legends? IfNA(default), include if any aesthetics are mapped. IfFALSE, never include or ifTRUE, always include. It can also be a namedlogicalvector to finely select the aesthetics to display.inherit.aeslogical. IfFALSE, overrides the default aesthetics, rather than combining with them.
Examples
library(ggplot2)
## we will use the ToothGrowth dataset for all examples
tg <- ToothGrowth
tg$dose <- as.factor(tg$dose)
tg$group <- factor(rep(c("grp1", "grp2"), 30))
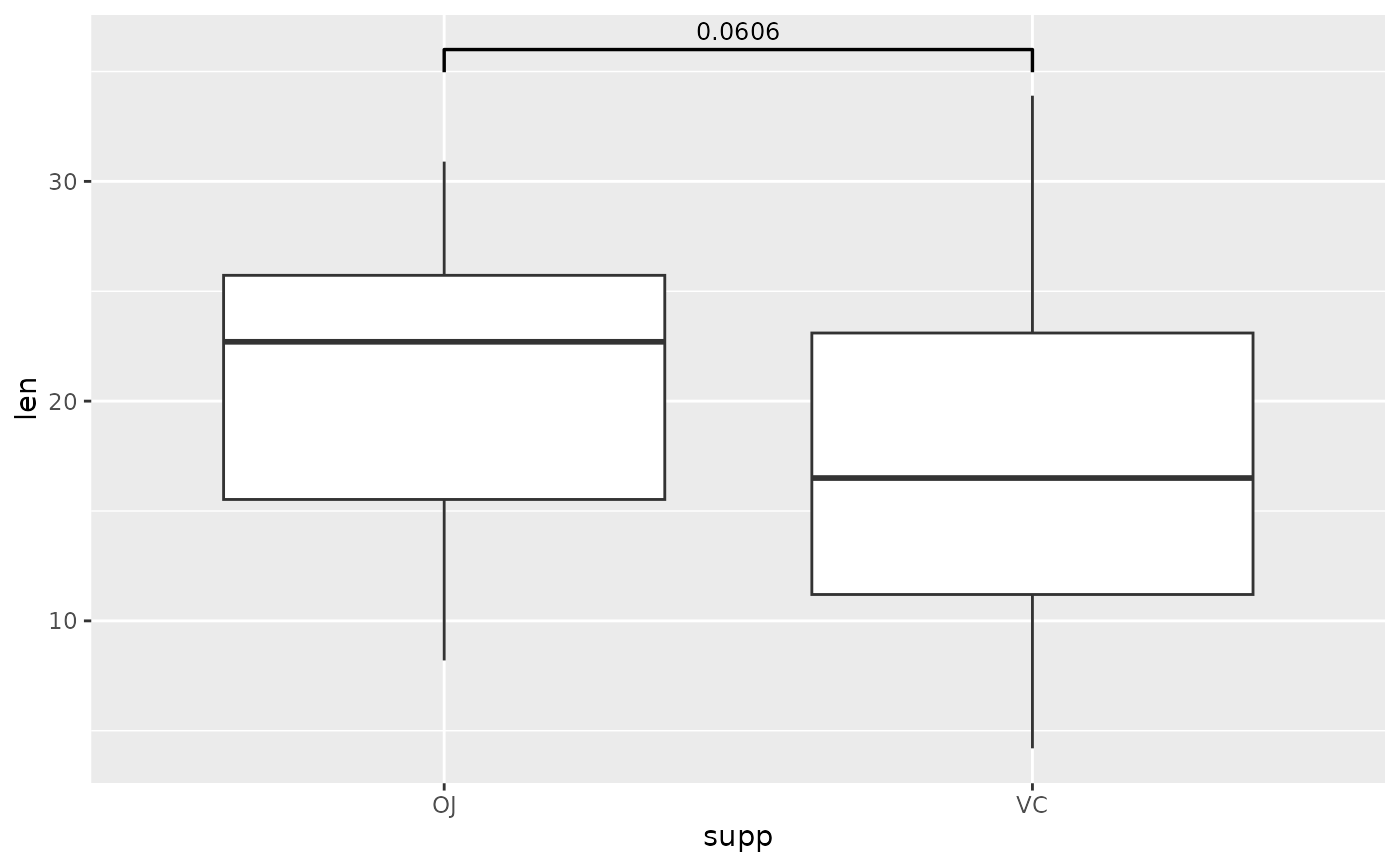
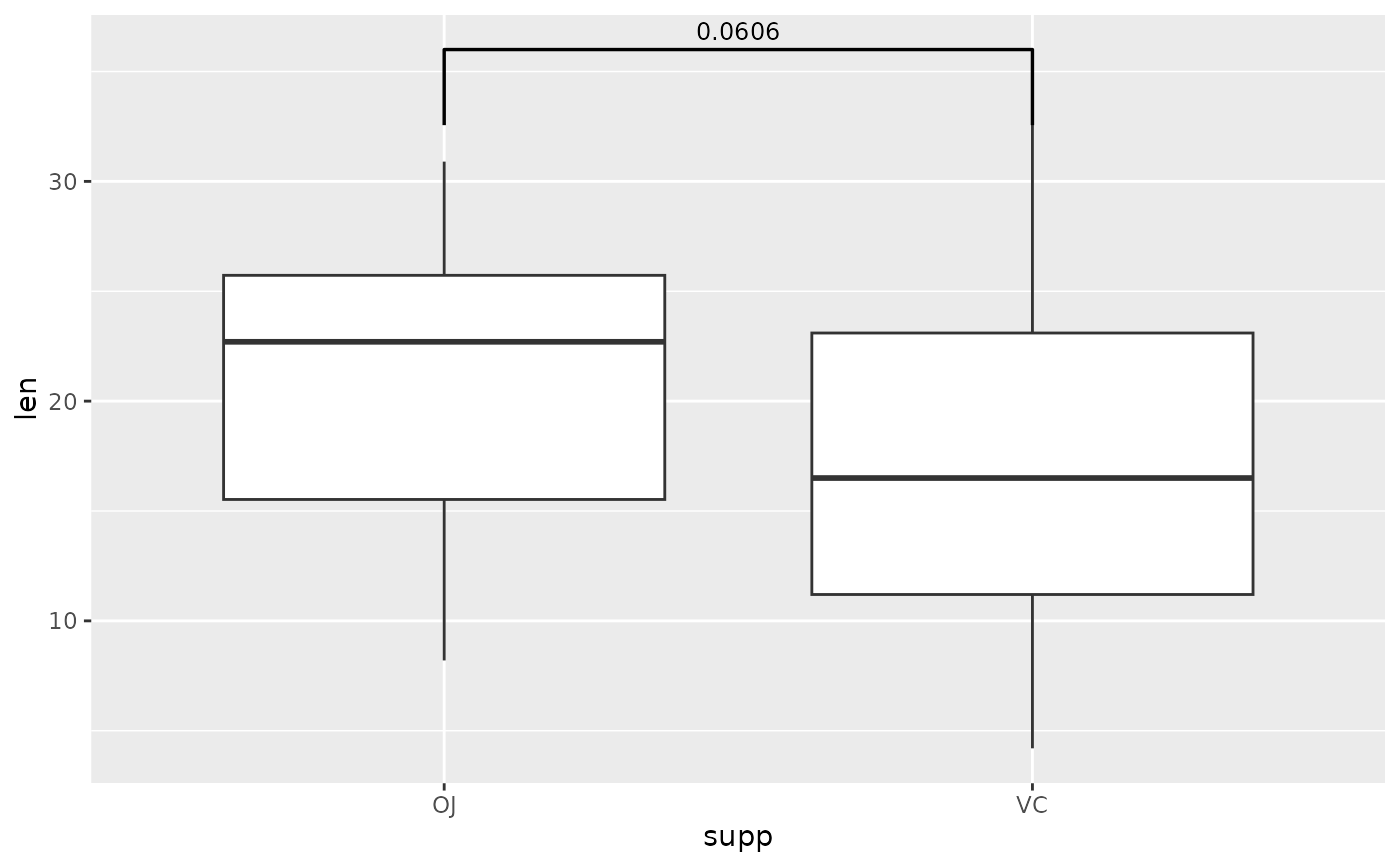
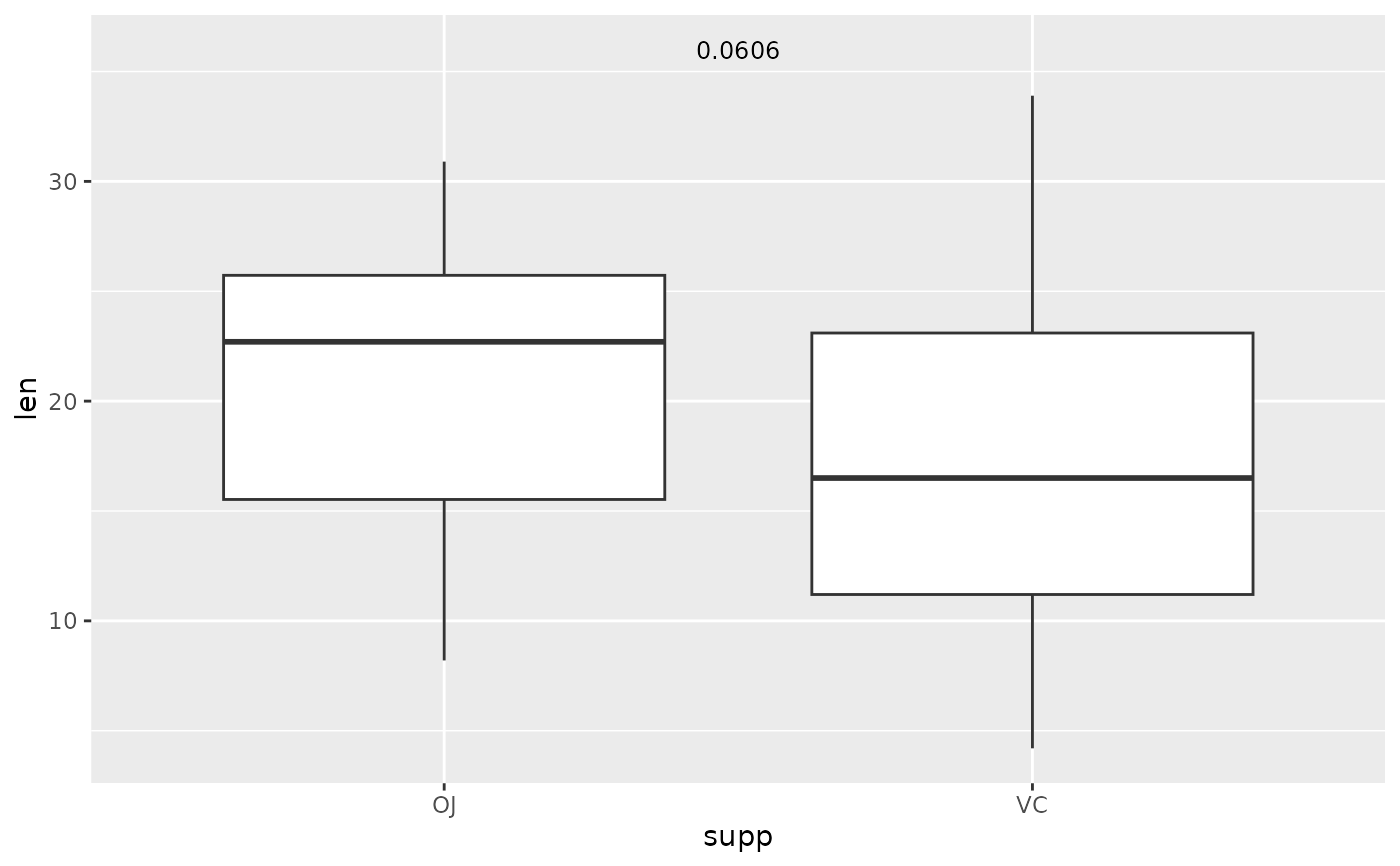
## p-value bracket comparing two means
# p-value table (its best to use these column names)
two.means <- tibble::tribble(
~group1, ~group2, ~p, ~y.position,
"OJ", "VC", 0.0606, 36
)
# boxplot (or another geom...)
ggplot(tg, aes(x = supp, y = len)) +
geom_boxplot() +
add_pvalue(two.means)
 # if your table has special column names you will need to specify them
two.means <- tibble::tribble(
~apple, ~banana, ~my.pval, ~some.y.position,
"OJ", "VC", 0.0606, 36
)
ggplot(tg, aes(x = supp, y = len)) +
geom_boxplot() +
add_pvalue(
two.means,
xmin = "apple",
xmax = "banana",
label = "my.pval",
y.position = "some.y.position"
)
# if your table has special column names you will need to specify them
two.means <- tibble::tribble(
~apple, ~banana, ~my.pval, ~some.y.position,
"OJ", "VC", 0.0606, 36
)
ggplot(tg, aes(x = supp, y = len)) +
geom_boxplot() +
add_pvalue(
two.means,
xmin = "apple",
xmax = "banana",
label = "my.pval",
y.position = "some.y.position"
)
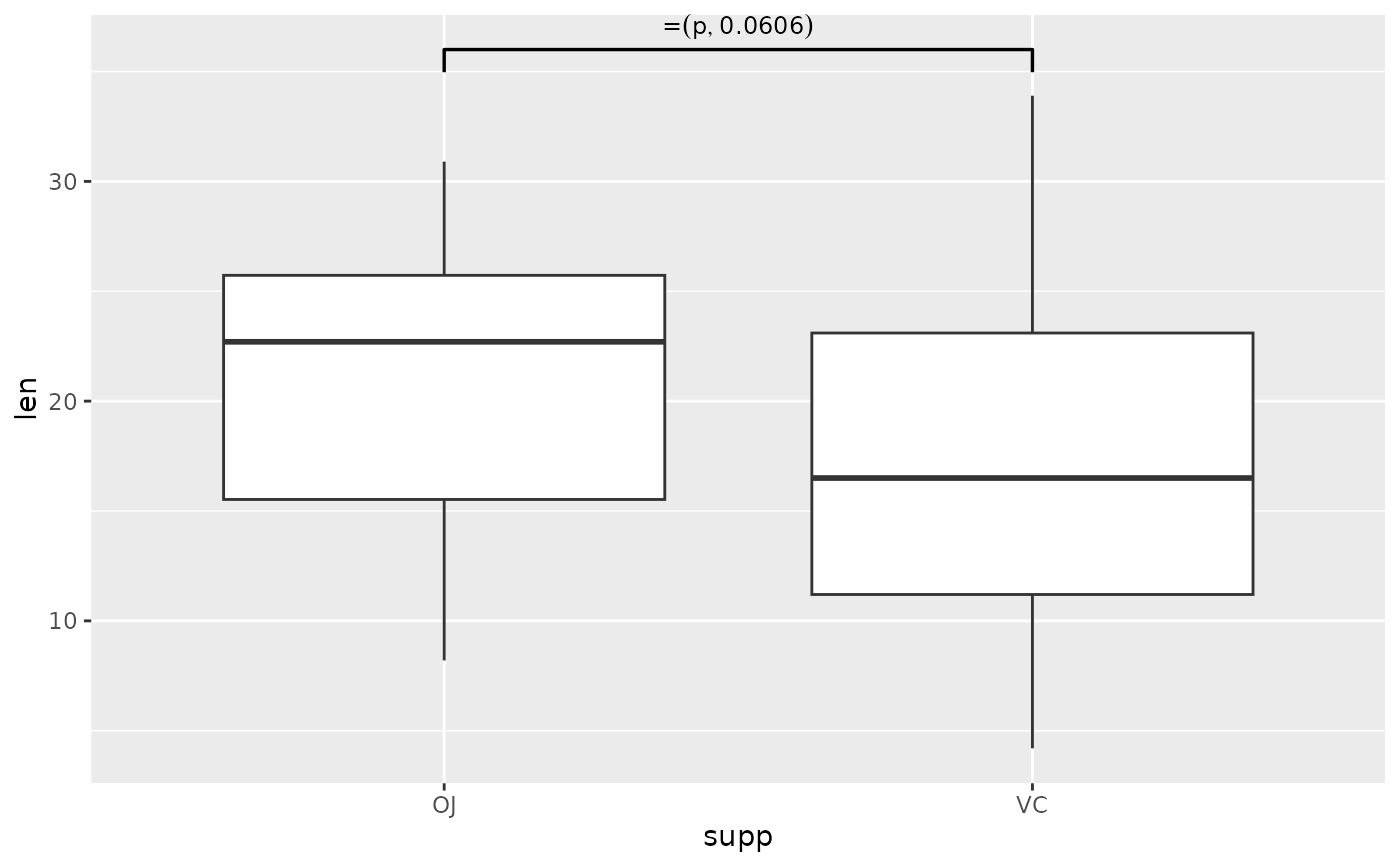
 ## you can make the label a glue expression
two.means <- tibble::tribble(
~group1, ~group2, ~p, ~y.position,
"OJ", "VC", 0.0606, 36
)
ggplot(tg, aes(x = supp, y = len)) +
geom_boxplot() +
add_pvalue(two.means, label = "p = {p}", parse = TRUE)
## you can make the label a glue expression
two.means <- tibble::tribble(
~group1, ~group2, ~p, ~y.position,
"OJ", "VC", 0.0606, 36
)
ggplot(tg, aes(x = supp, y = len)) +
geom_boxplot() +
add_pvalue(two.means, label = "p = {p}", parse = TRUE)
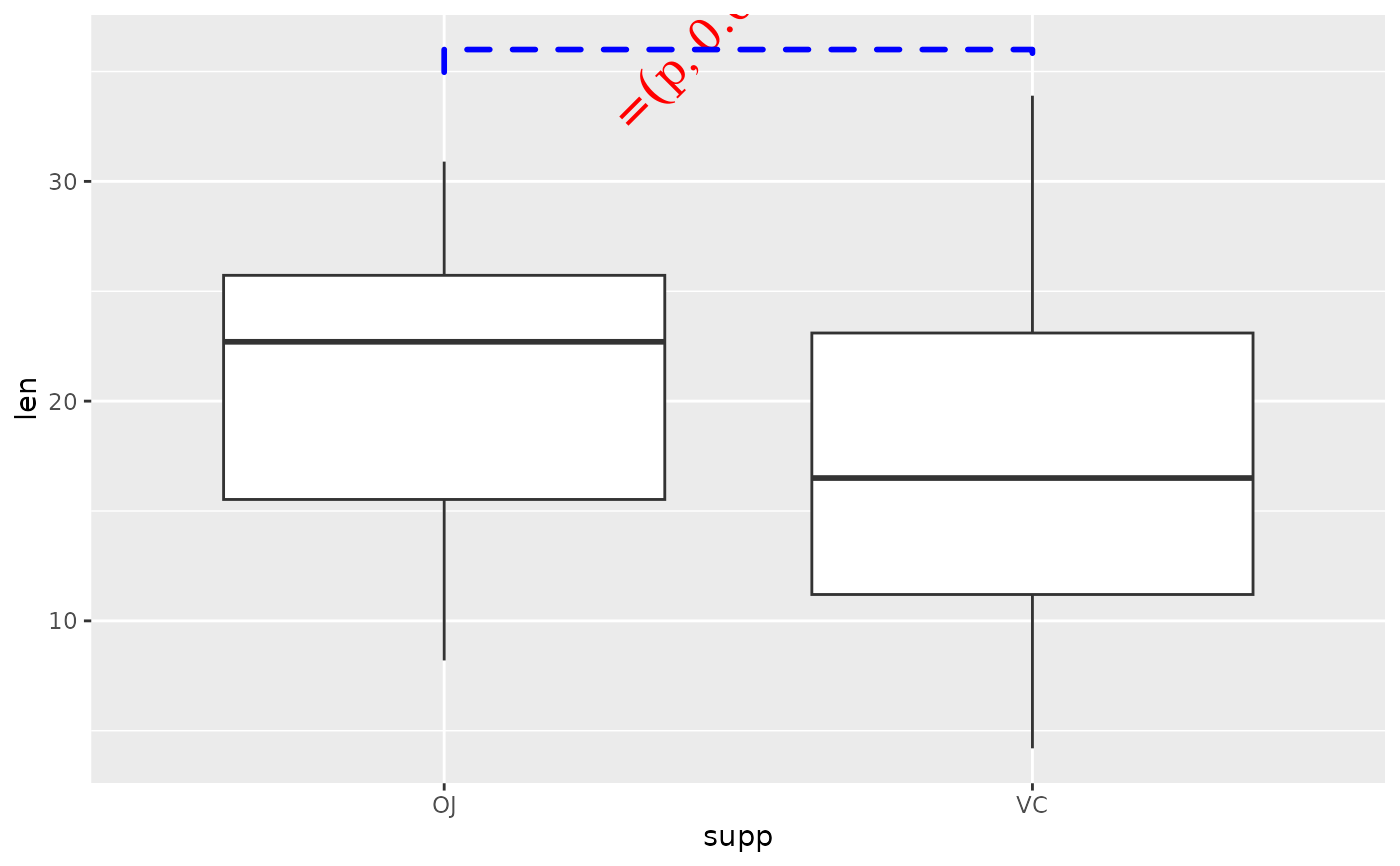
 ## you can change aesthetics of the bracket and label
ggplot(tg, aes(x = supp, y = len)) +
geom_boxplot() +
add_pvalue(
two.means,
label = "p = {p}",
parse = TRUE,
colour = "red", # label
label.size = 6, # label
fontface = "bold", # label
fontfamily = "serif", # label
angle = 45, # label
bracket.colour = "blue", # bracket
bracket.size = 1, # bracket
linetype = "dashed", # bracket
lineend = "round" # bracket
)
## you can change aesthetics of the bracket and label
ggplot(tg, aes(x = supp, y = len)) +
geom_boxplot() +
add_pvalue(
two.means,
label = "p = {p}",
parse = TRUE,
colour = "red", # label
label.size = 6, # label
fontface = "bold", # label
fontfamily = "serif", # label
angle = 45, # label
bracket.colour = "blue", # bracket
bracket.size = 1, # bracket
linetype = "dashed", # bracket
lineend = "round" # bracket
)
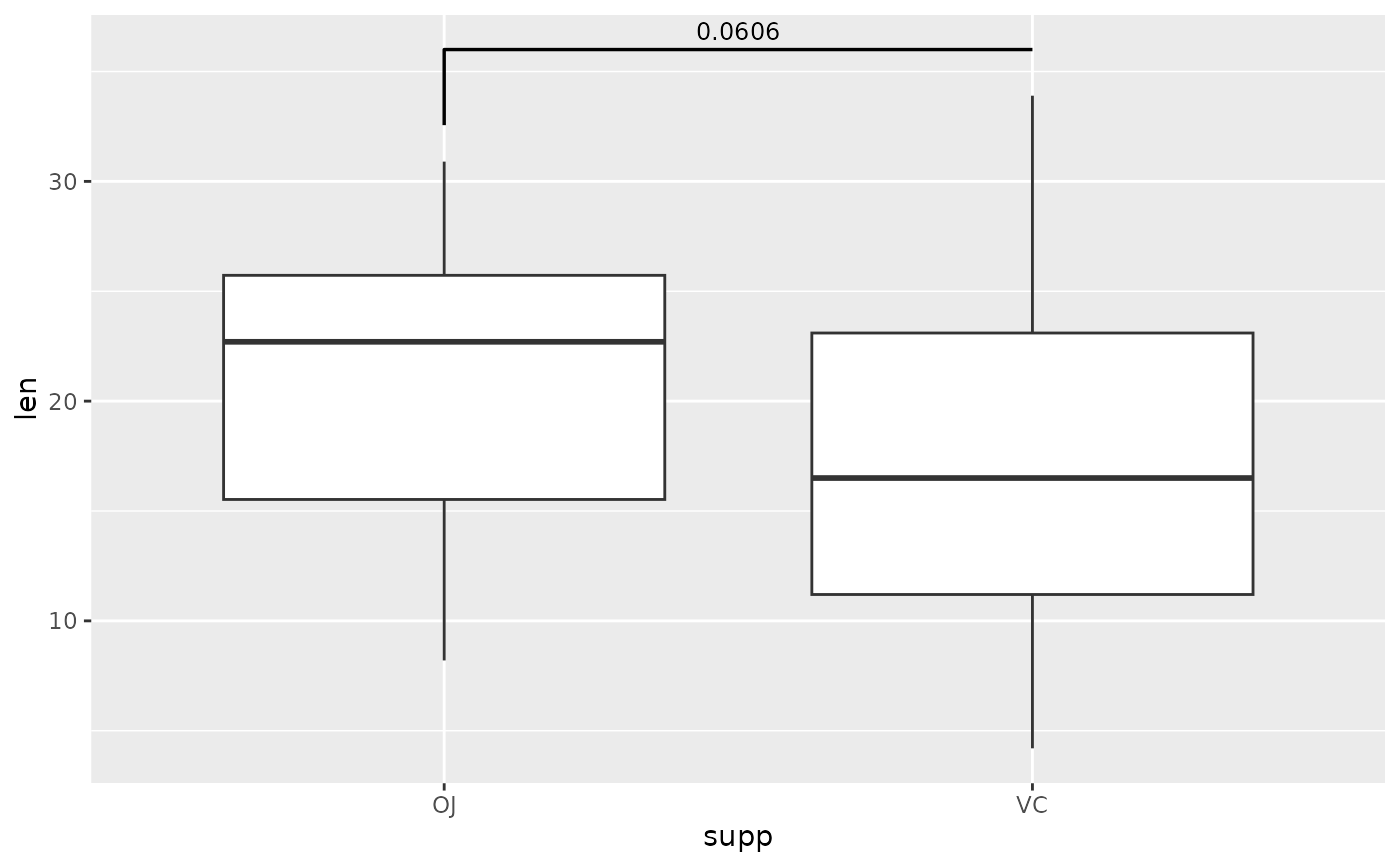
 ## you can change the tip length of the bracket
# make them longer
ggplot(tg, aes(x = supp, y = len)) +
geom_boxplot() +
add_pvalue(two.means, tip.length = 0.1)
## you can change the tip length of the bracket
# make them longer
ggplot(tg, aes(x = supp, y = len)) +
geom_boxplot() +
add_pvalue(two.means, tip.length = 0.1)
 # make them disappear
ggplot(tg, aes(x = supp, y = len)) +
geom_boxplot() +
add_pvalue(two.means, tip.length = 0)
# make them disappear
ggplot(tg, aes(x = supp, y = len)) +
geom_boxplot() +
add_pvalue(two.means, tip.length = 0)
 # make one side longer than the other
ggplot(tg, aes(x = supp, y = len)) +
geom_boxplot() +
add_pvalue(two.means, tip.length = c(0.1, 0))
# make one side longer than the other
ggplot(tg, aes(x = supp, y = len)) +
geom_boxplot() +
add_pvalue(two.means, tip.length = c(0.1, 0))
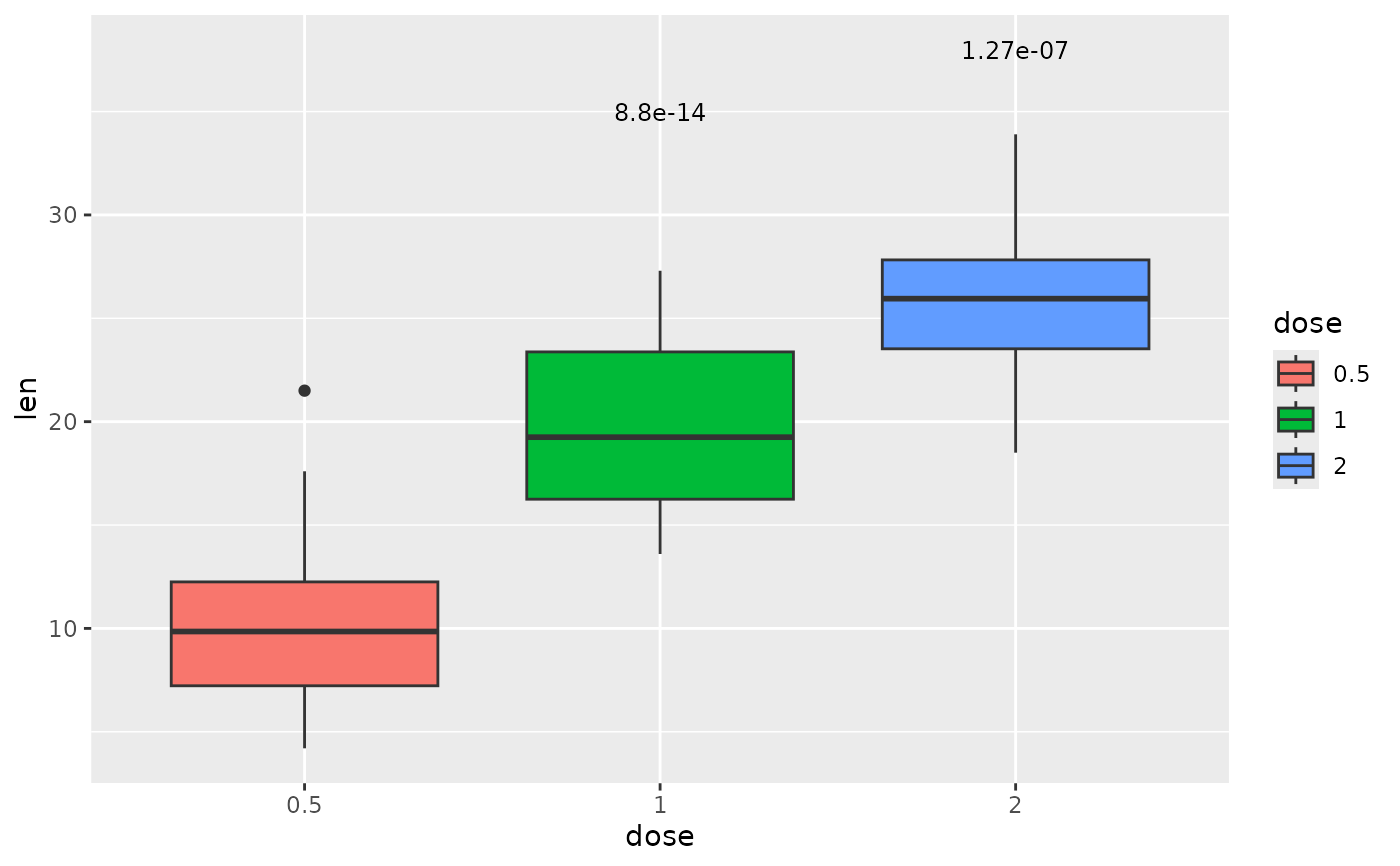
 ## p-value brackets with comparisons to a reference sample
each.vs.ref <- tibble::tribble(
~group1, ~group2, ~p.adj, ~y.position,
"0.5", "1", 8.80e-14, 35,
"0.5", "2", 1.27e-7, 38
)
ggplot(tg, aes(x = dose, y = len)) +
geom_boxplot(aes(fill = dose)) +
add_pvalue(each.vs.ref)
## p-value brackets with comparisons to a reference sample
each.vs.ref <- tibble::tribble(
~group1, ~group2, ~p.adj, ~y.position,
"0.5", "1", 8.80e-14, 35,
"0.5", "2", 1.27e-7, 38
)
ggplot(tg, aes(x = dose, y = len)) +
geom_boxplot(aes(fill = dose)) +
add_pvalue(each.vs.ref)
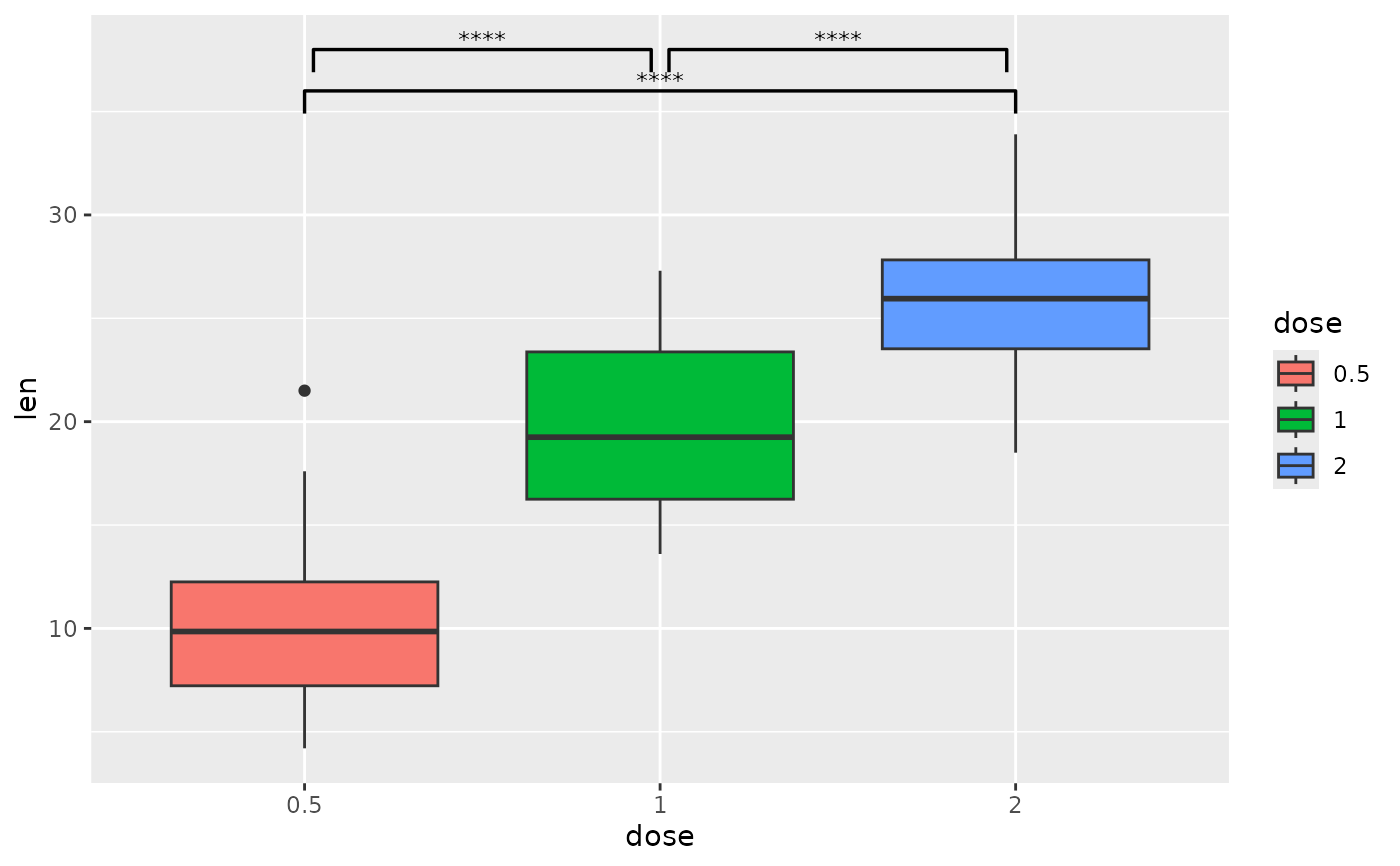
 ## p-value brackets with pairwise comparisons
pairwise <- tibble::tribble(
~group1, ~group2, ~p.signif, ~y.position,
"0.5", "1", "****", 38,
"0.5", "2", "****", 36,
"1", "2", "****", 38
)
# you can shorten the length of brackets that are close together
ggplot(tg, aes(x = dose, y = len)) +
geom_boxplot(aes(fill = dose)) +
add_pvalue(
pairwise,
bracket.shorten = c(0.05, 0, 0.05)
)
## p-value brackets with pairwise comparisons
pairwise <- tibble::tribble(
~group1, ~group2, ~p.signif, ~y.position,
"0.5", "1", "****", 38,
"0.5", "2", "****", 36,
"1", "2", "****", 38
)
# you can shorten the length of brackets that are close together
ggplot(tg, aes(x = dose, y = len)) +
geom_boxplot(aes(fill = dose)) +
add_pvalue(
pairwise,
bracket.shorten = c(0.05, 0, 0.05)
)
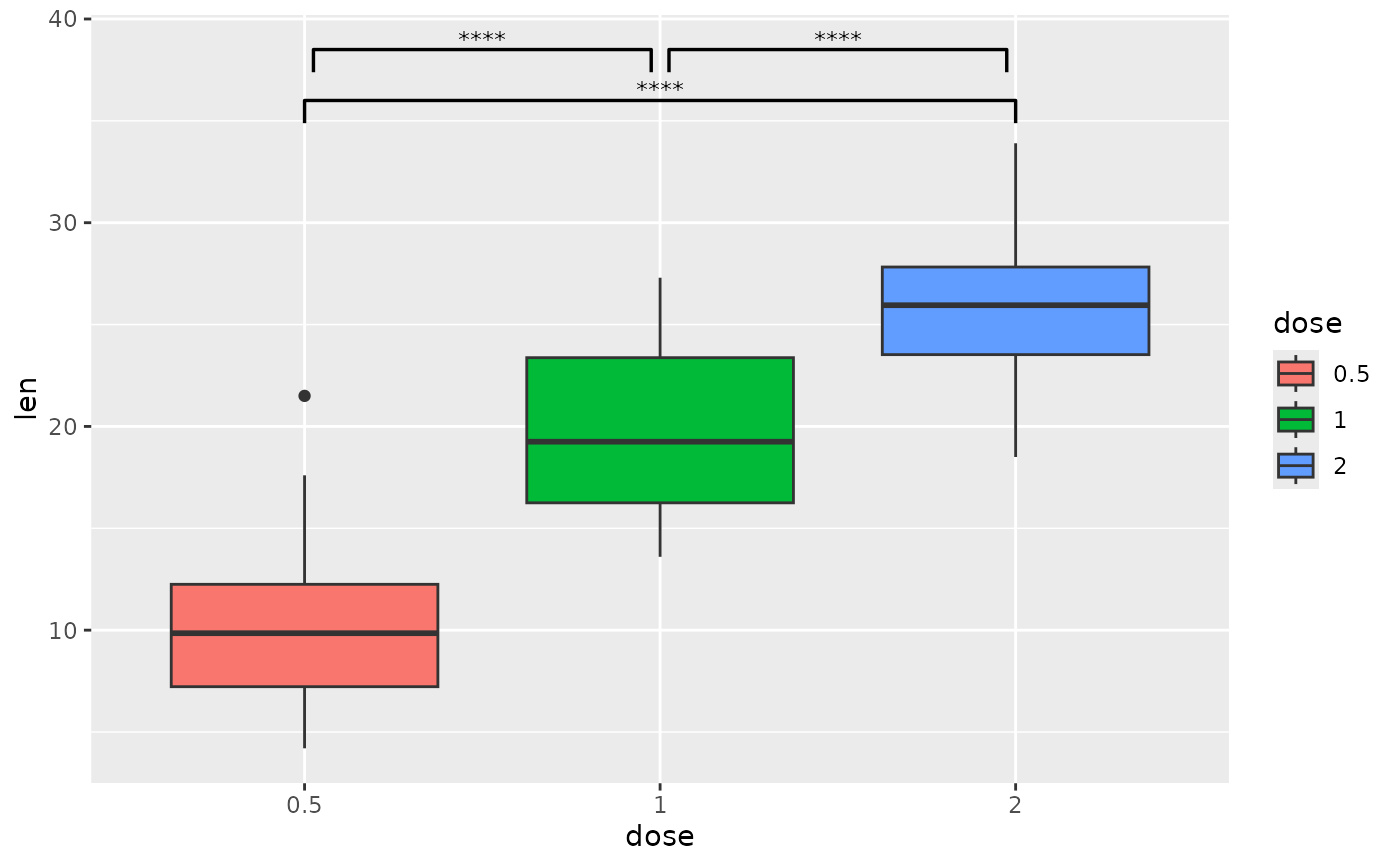
 # you can nudge brackets that are not quite in the correct y position
# instead of changing the p-value table
ggplot(tg, aes(x = dose, y = len)) +
geom_boxplot(aes(fill = dose)) +
add_pvalue(
pairwise,
bracket.shorten = c(0.05, 0, 0.05),
bracket.nudge.y = c(0.5, 0, 0.5)
)
# you can nudge brackets that are not quite in the correct y position
# instead of changing the p-value table
ggplot(tg, aes(x = dose, y = len)) +
geom_boxplot(aes(fill = dose)) +
add_pvalue(
pairwise,
bracket.shorten = c(0.05, 0, 0.05),
bracket.nudge.y = c(0.5, 0, 0.5)
)
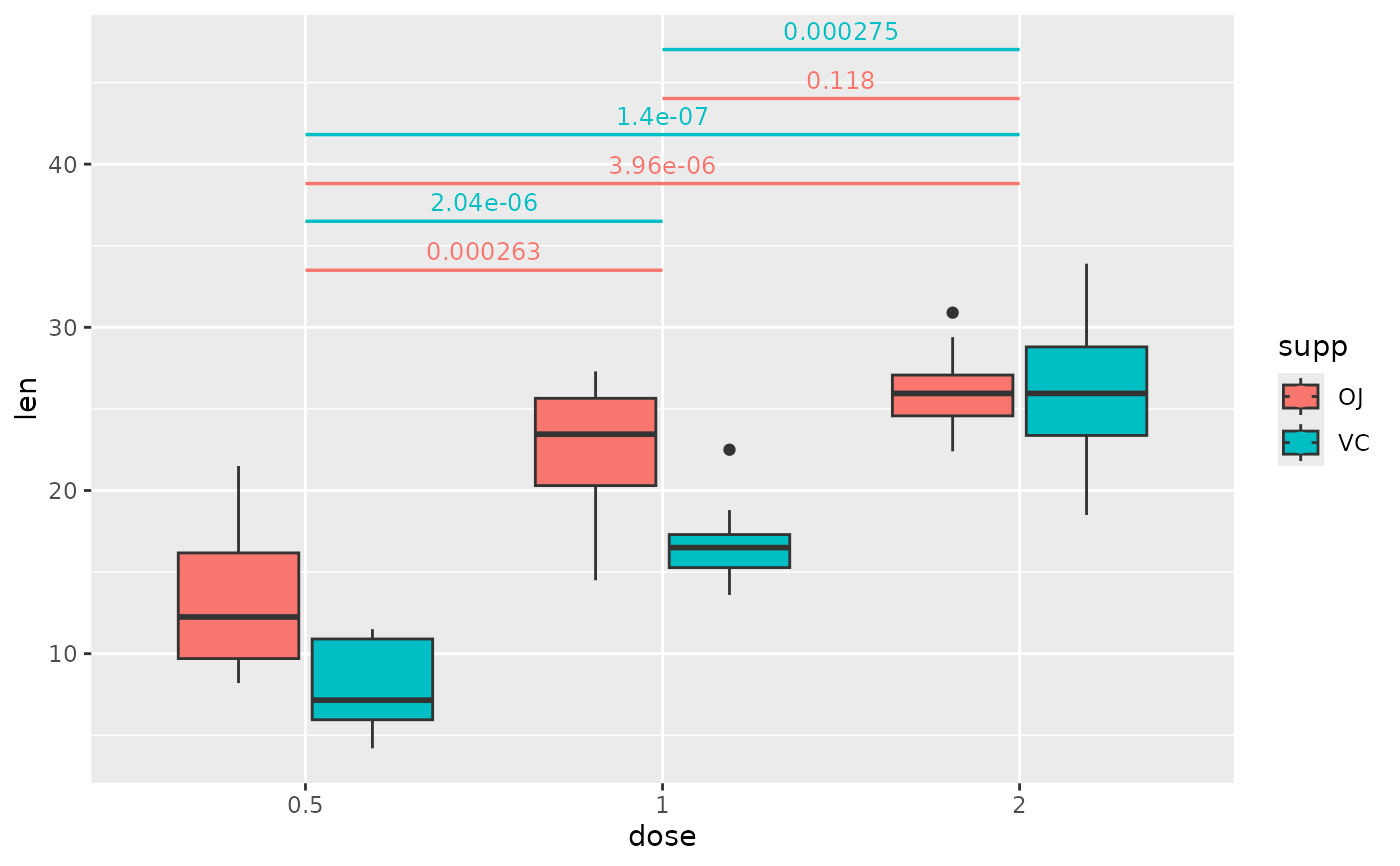
 ## p-value brackets with pairwise comparisons of grouped data
pairwise.grouped <- tibble::tribble(
~group1, ~group2, ~p.adj, ~y.position, ~supp,
"0.5", "1", 2.63e-4, 33.5, "OJ",
"0.5", "2", 3.96e-6, 37.6, "OJ",
"1", "2", 1.18e-1, 41.6, "OJ",
"0.5", "1", 2.04e-6, 36.5, "VC",
"0.5", "2", 1.40e-7, 40.6, "VC",
"1", "2", 2.75e-4, 44.6, "VC"
)
# use step.increase to change the spacing between different brackets in the
# groups specified by step.group.by
ggplot(tg, aes(x = dose, y = len)) +
geom_boxplot(aes(fill = supp)) +
add_pvalue(
pairwise.grouped,
colour = "supp",
tip.length = 0,
step.group.by = "supp",
step.increase = 0.03
)
## p-value brackets with pairwise comparisons of grouped data
pairwise.grouped <- tibble::tribble(
~group1, ~group2, ~p.adj, ~y.position, ~supp,
"0.5", "1", 2.63e-4, 33.5, "OJ",
"0.5", "2", 3.96e-6, 37.6, "OJ",
"1", "2", 1.18e-1, 41.6, "OJ",
"0.5", "1", 2.04e-6, 36.5, "VC",
"0.5", "2", 1.40e-7, 40.6, "VC",
"1", "2", 2.75e-4, 44.6, "VC"
)
# use step.increase to change the spacing between different brackets in the
# groups specified by step.group.by
ggplot(tg, aes(x = dose, y = len)) +
geom_boxplot(aes(fill = supp)) +
add_pvalue(
pairwise.grouped,
colour = "supp",
tip.length = 0,
step.group.by = "supp",
step.increase = 0.03
)
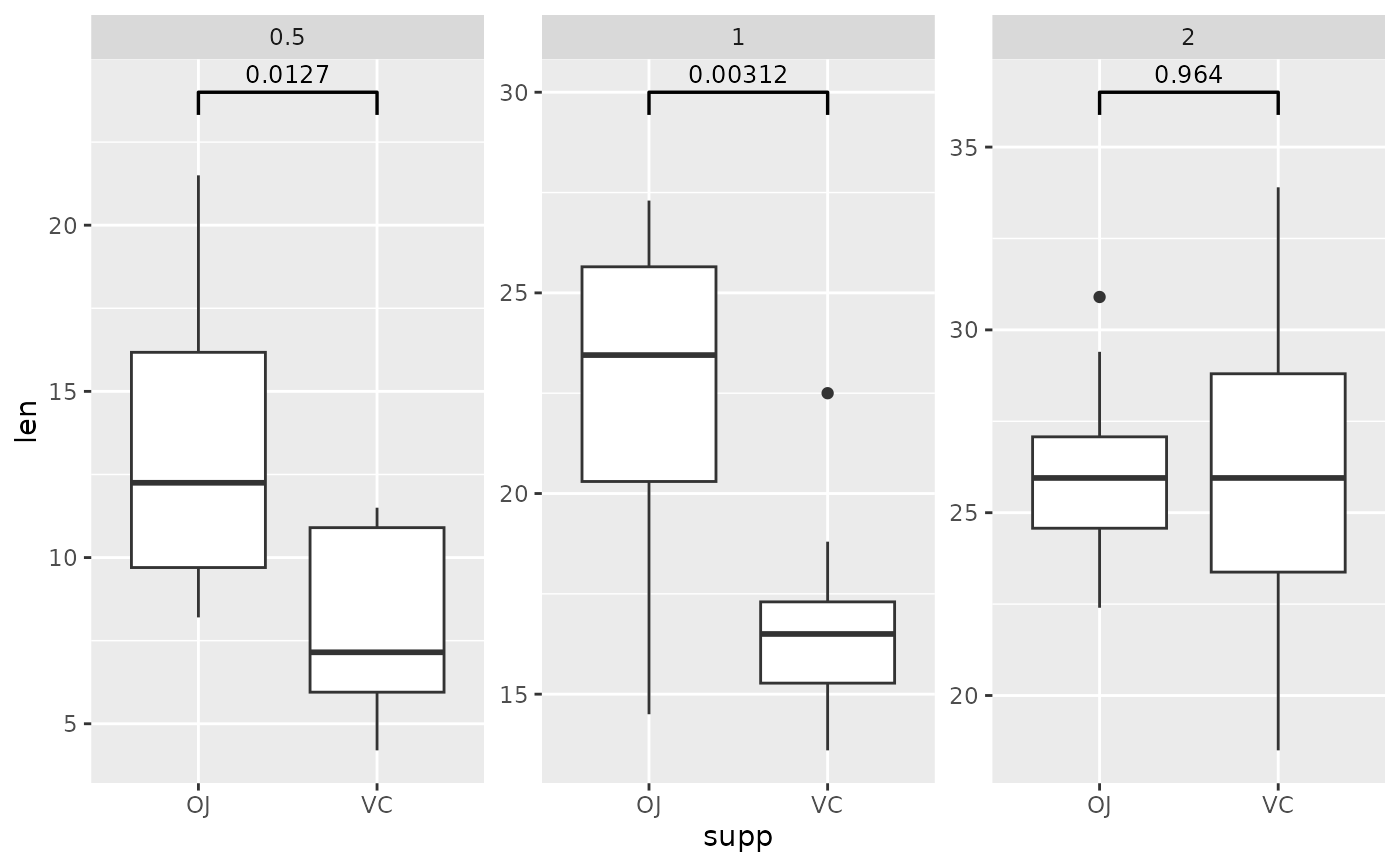
 ## p-value (brackets) with single facet variable
two.means.grouped1 <- tibble::tribble(
~group1, ~group2, ~p.adj, ~y.position, ~dose,
"OJ", "VC", 0.0127, 24, "0.5",
"OJ", "VC", 0.00312, 30, "1",
"OJ", "VC", 0.964, 36.5, "2"
)
ggplot(tg, aes(x = supp, y = len)) +
geom_boxplot() +
facet_wrap(~ dose, scales = "free") +
add_pvalue(two.means.grouped1) # table must have dose column
## p-value (brackets) with single facet variable
two.means.grouped1 <- tibble::tribble(
~group1, ~group2, ~p.adj, ~y.position, ~dose,
"OJ", "VC", 0.0127, 24, "0.5",
"OJ", "VC", 0.00312, 30, "1",
"OJ", "VC", 0.964, 36.5, "2"
)
ggplot(tg, aes(x = supp, y = len)) +
geom_boxplot() +
facet_wrap(~ dose, scales = "free") +
add_pvalue(two.means.grouped1) # table must have dose column
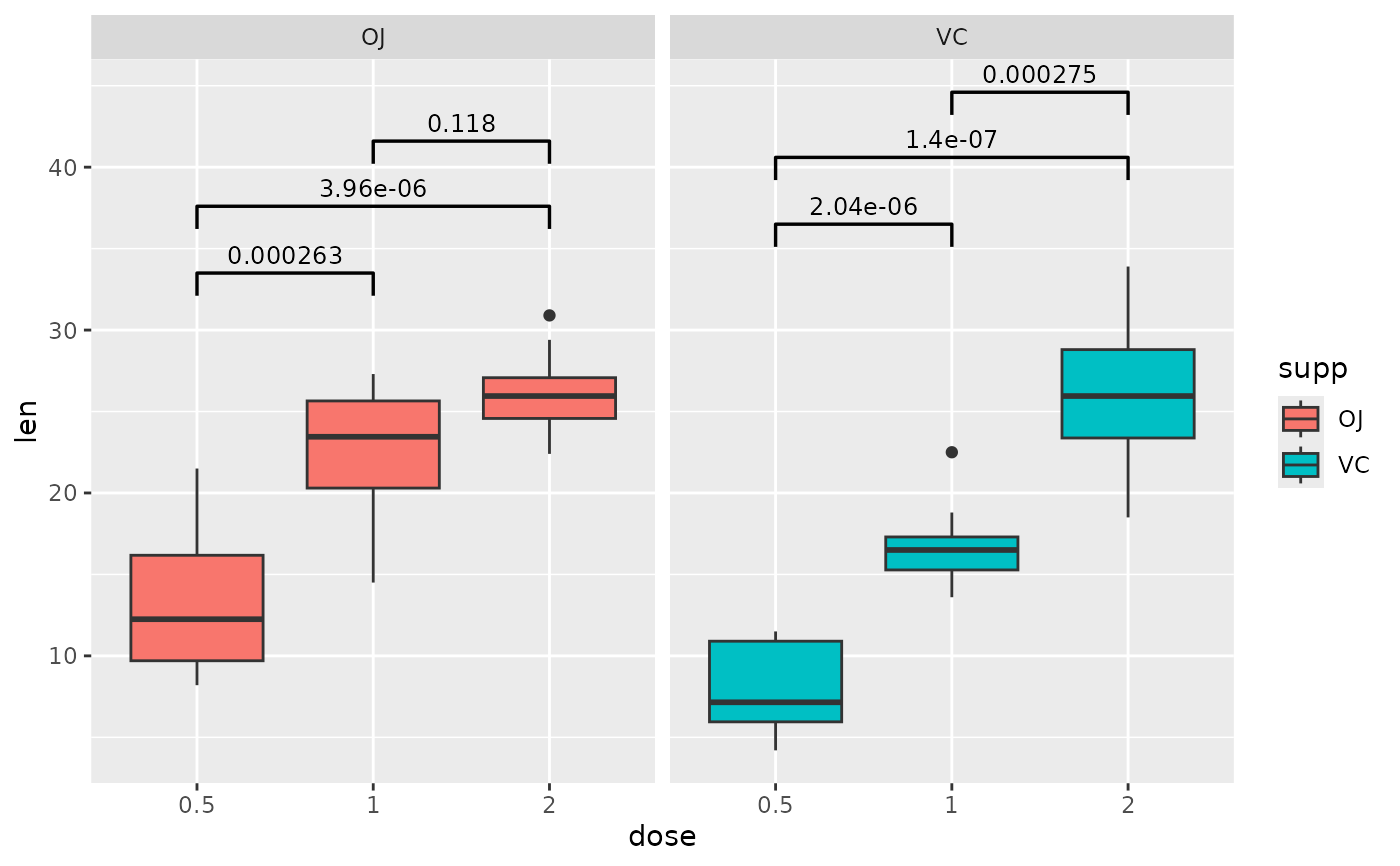
 ## p-value (brackets) with single facet variable and multiple brackets per facet
pairwise.grouped <- tibble::tribble(
~group1, ~group2, ~p.adj, ~y.position, ~supp,
"0.5", "1", 2.63e-4, 33.5, "OJ",
"0.5", "2", 3.96e-6, 37.6, "OJ",
"1", "2", 1.18e-1, 41.6, "OJ",
"0.5", "1", 2.04e-6, 36.5, "VC",
"0.5", "2", 1.40e-7, 40.6, "VC",
"1", "2", 2.75e-4, 44.6, "VC"
)
ggplot(tg, aes(x = dose, y = len)) +
geom_boxplot(aes(fill = supp)) +
facet_wrap(~ supp) +
add_pvalue(pairwise.grouped)
## p-value (brackets) with single facet variable and multiple brackets per facet
pairwise.grouped <- tibble::tribble(
~group1, ~group2, ~p.adj, ~y.position, ~supp,
"0.5", "1", 2.63e-4, 33.5, "OJ",
"0.5", "2", 3.96e-6, 37.6, "OJ",
"1", "2", 1.18e-1, 41.6, "OJ",
"0.5", "1", 2.04e-6, 36.5, "VC",
"0.5", "2", 1.40e-7, 40.6, "VC",
"1", "2", 2.75e-4, 44.6, "VC"
)
ggplot(tg, aes(x = dose, y = len)) +
geom_boxplot(aes(fill = supp)) +
facet_wrap(~ supp) +
add_pvalue(pairwise.grouped)
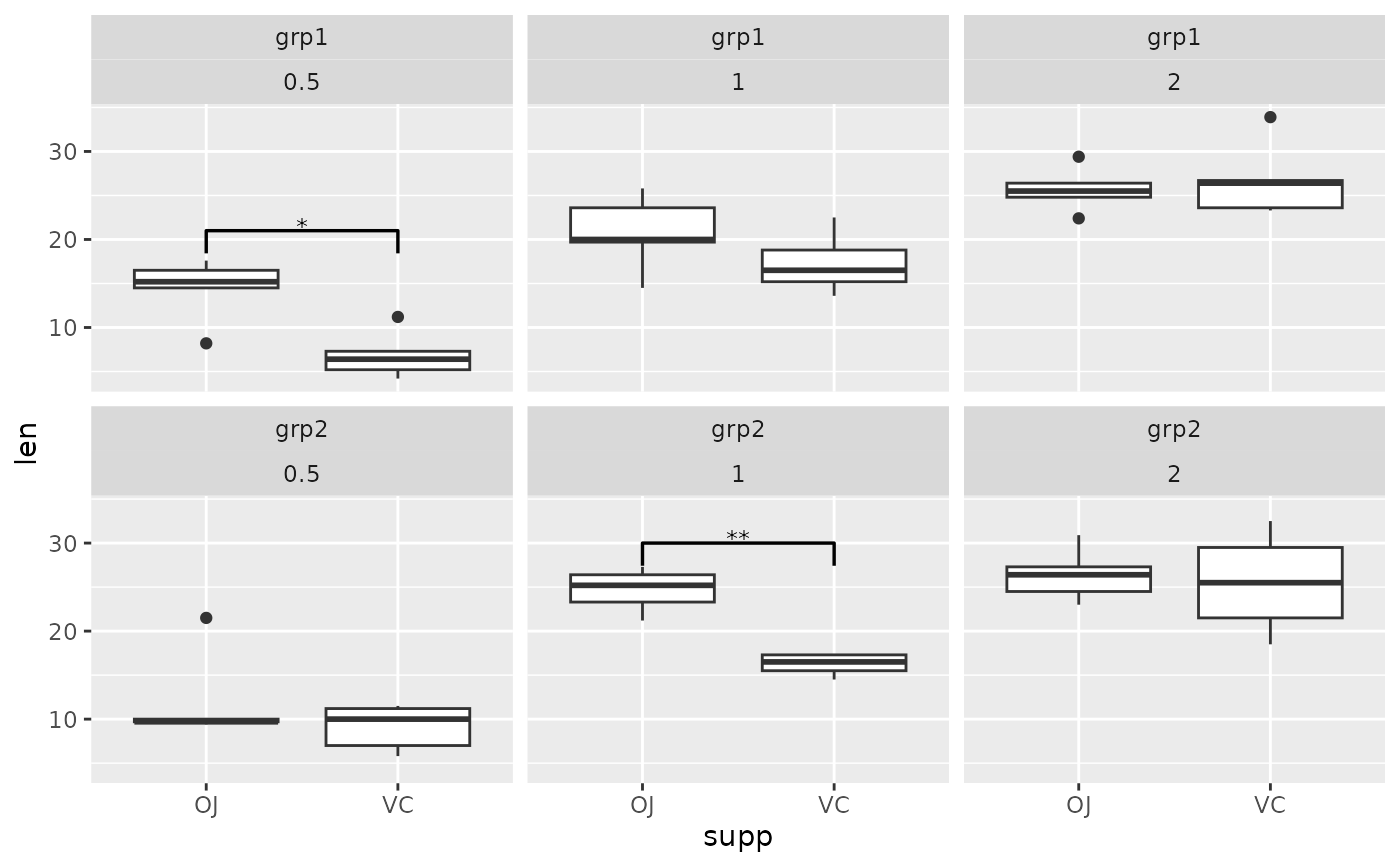
 ## p-value (brackets) with two facet variables
two.means.grouped2 <- tibble::tribble(
~group1, ~group2, ~p.signif, ~y.position, ~group, ~dose,
"OJ", "VC", "*", 21, "grp1", "0.5",
"OJ", "VC", "**", 30, "grp2", "1"
)
ggplot(tg, aes(x = supp, y = len)) +
geom_boxplot() +
facet_wrap(group ~ dose) +
add_pvalue(two.means.grouped2) # table must have dose and group column
## p-value (brackets) with two facet variables
two.means.grouped2 <- tibble::tribble(
~group1, ~group2, ~p.signif, ~y.position, ~group, ~dose,
"OJ", "VC", "*", 21, "grp1", "0.5",
"OJ", "VC", "**", 30, "grp2", "1"
)
ggplot(tg, aes(x = supp, y = len)) +
geom_boxplot() +
facet_wrap(group ~ dose) +
add_pvalue(two.means.grouped2) # table must have dose and group column
 ## p-value (text only) comparing two means
two.means <- tibble::tribble(
~group1, ~group2, ~p, ~y.position,
"OJ", "VC", 0.0606, 36
)
ggplot(tg, aes(x = supp, y = len)) +
geom_boxplot() +
add_pvalue(two.means, remove.bracket = TRUE, x = 1.5)
## p-value (text only) comparing two means
two.means <- tibble::tribble(
~group1, ~group2, ~p, ~y.position,
"OJ", "VC", 0.0606, 36
)
ggplot(tg, aes(x = supp, y = len)) +
geom_boxplot() +
add_pvalue(two.means, remove.bracket = TRUE, x = 1.5)
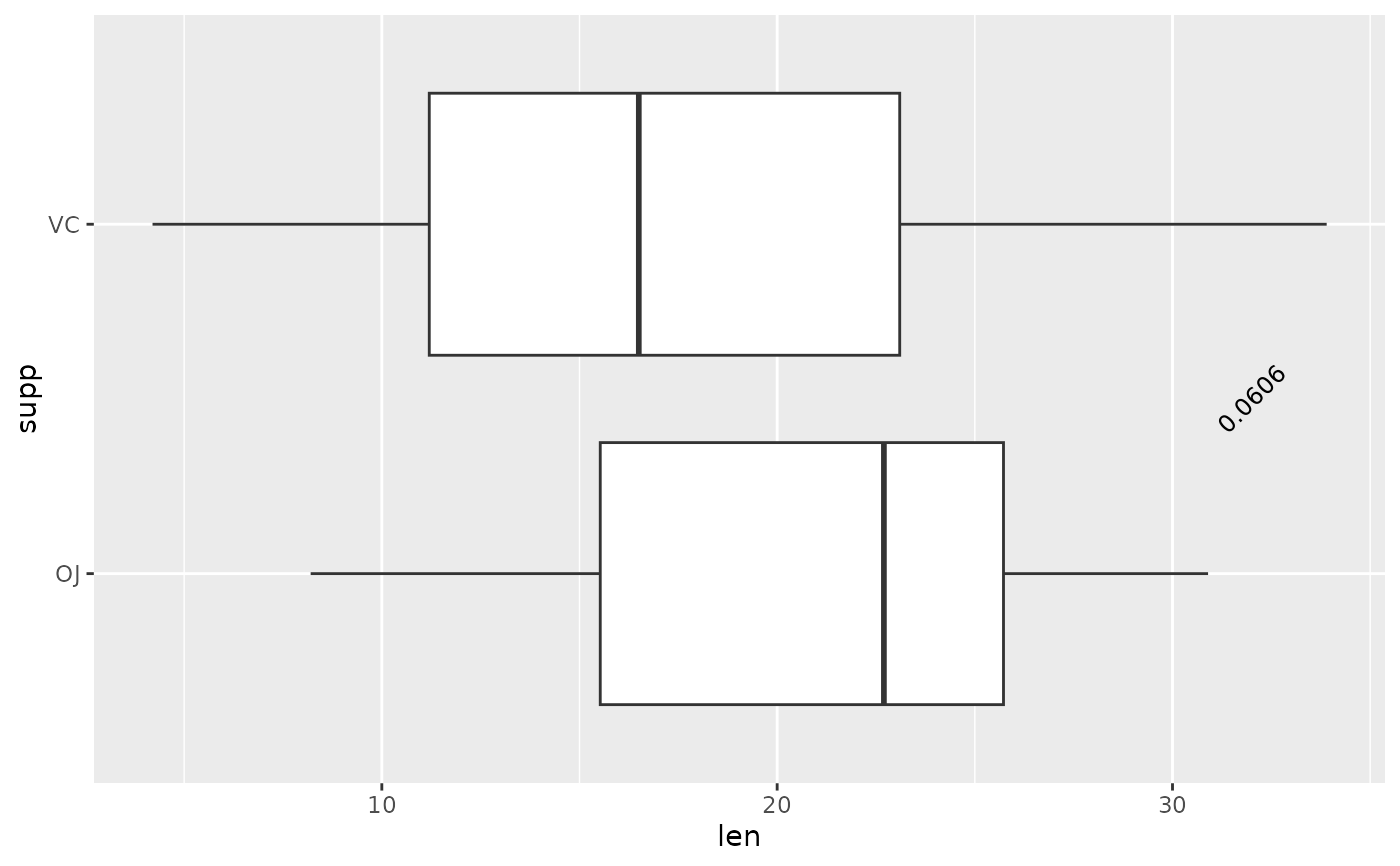
 ## p-value (text only) with coord_flip, override y.position, change angle
ggplot(tg, aes(x = supp, y = len)) +
geom_boxplot() +
add_pvalue(
two.means,
remove.bracket = TRUE,
x = 1.5,
y.position = 32,
angle = 45
) +
coord_flip()
## p-value (text only) with coord_flip, override y.position, change angle
ggplot(tg, aes(x = supp, y = len)) +
geom_boxplot() +
add_pvalue(
two.means,
remove.bracket = TRUE,
x = 1.5,
y.position = 32,
angle = 45
) +
coord_flip()
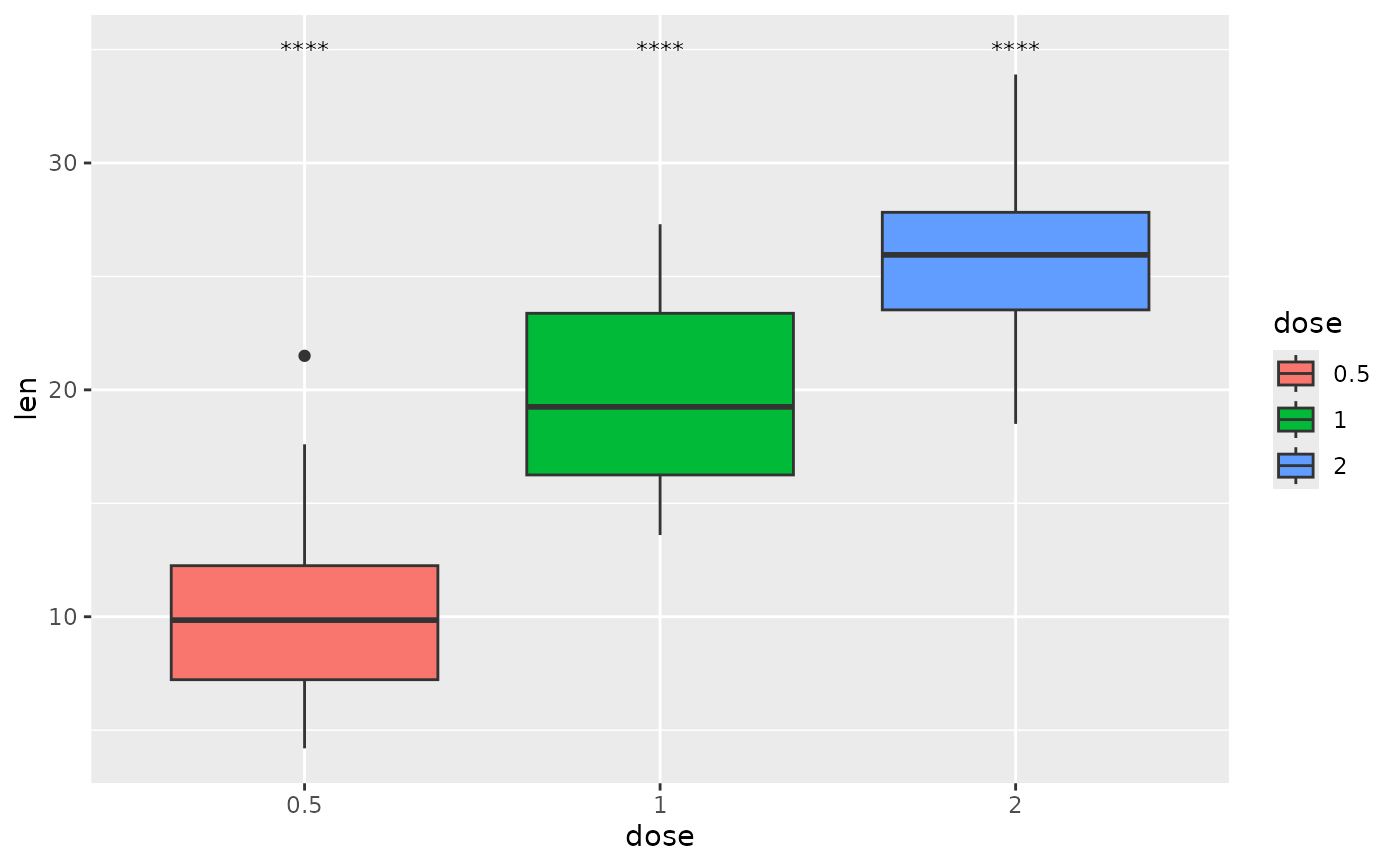
 ## p-value (text only) comparing to the null
one.mean <- tibble::tribble(
~group1, ~group2, ~p.signif, ~y.position, ~dose,
"1", "null model", "****", 35, "0.5",
"1", "null model", "****", 35, "1",
"1", "null model", "****", 35, "2"
)
ggplot(tg, aes(x = dose, y = len)) +
geom_boxplot(aes(fill = dose)) +
add_pvalue(one.mean, x = "dose")
## p-value (text only) comparing to the null
one.mean <- tibble::tribble(
~group1, ~group2, ~p.signif, ~y.position, ~dose,
"1", "null model", "****", 35, "0.5",
"1", "null model", "****", 35, "1",
"1", "null model", "****", 35, "2"
)
ggplot(tg, aes(x = dose, y = len)) +
geom_boxplot(aes(fill = dose)) +
add_pvalue(one.mean, x = "dose")
 ## p-value (text only) with comparisons to a base mean
each.vs.basemean <- tibble::tribble(
~group1, ~group2, ~p.adj, ~y.position,
"all", "0.5", "****", 35,
"all", "1", "ns", 35,
"all", "2", "****", 35
)
ggplot(tg, aes(x = dose, y = len)) +
geom_boxplot(aes(fill = dose)) +
add_pvalue(each.vs.basemean)
## p-value (text only) with comparisons to a base mean
each.vs.basemean <- tibble::tribble(
~group1, ~group2, ~p.adj, ~y.position,
"all", "0.5", "****", 35,
"all", "1", "ns", 35,
"all", "2", "****", 35
)
ggplot(tg, aes(x = dose, y = len)) +
geom_boxplot(aes(fill = dose)) +
add_pvalue(each.vs.basemean)
 ## p-value (text only) with comparison to reference sample
each.vs.ref <- tibble::tribble(
~group1, ~group2, ~p.adj, ~y.position,
"0.5", "1", 8.80e-14, 35,
"0.5", "2", 1.27e-7, 38
)
ggplot(tg, aes(x = dose, y = len)) +
geom_boxplot(aes(fill = dose)) +
add_pvalue(each.vs.ref, coord.flip = TRUE, remove.bracket = TRUE)
#> The `coord.flip = TRUE` argument is no longer necessary and can be removed.
## p-value (text only) with comparison to reference sample
each.vs.ref <- tibble::tribble(
~group1, ~group2, ~p.adj, ~y.position,
"0.5", "1", 8.80e-14, 35,
"0.5", "2", 1.27e-7, 38
)
ggplot(tg, aes(x = dose, y = len)) +
geom_boxplot(aes(fill = dose)) +
add_pvalue(each.vs.ref, coord.flip = TRUE, remove.bracket = TRUE)
#> The `coord.flip = TRUE` argument is no longer necessary and can be removed.
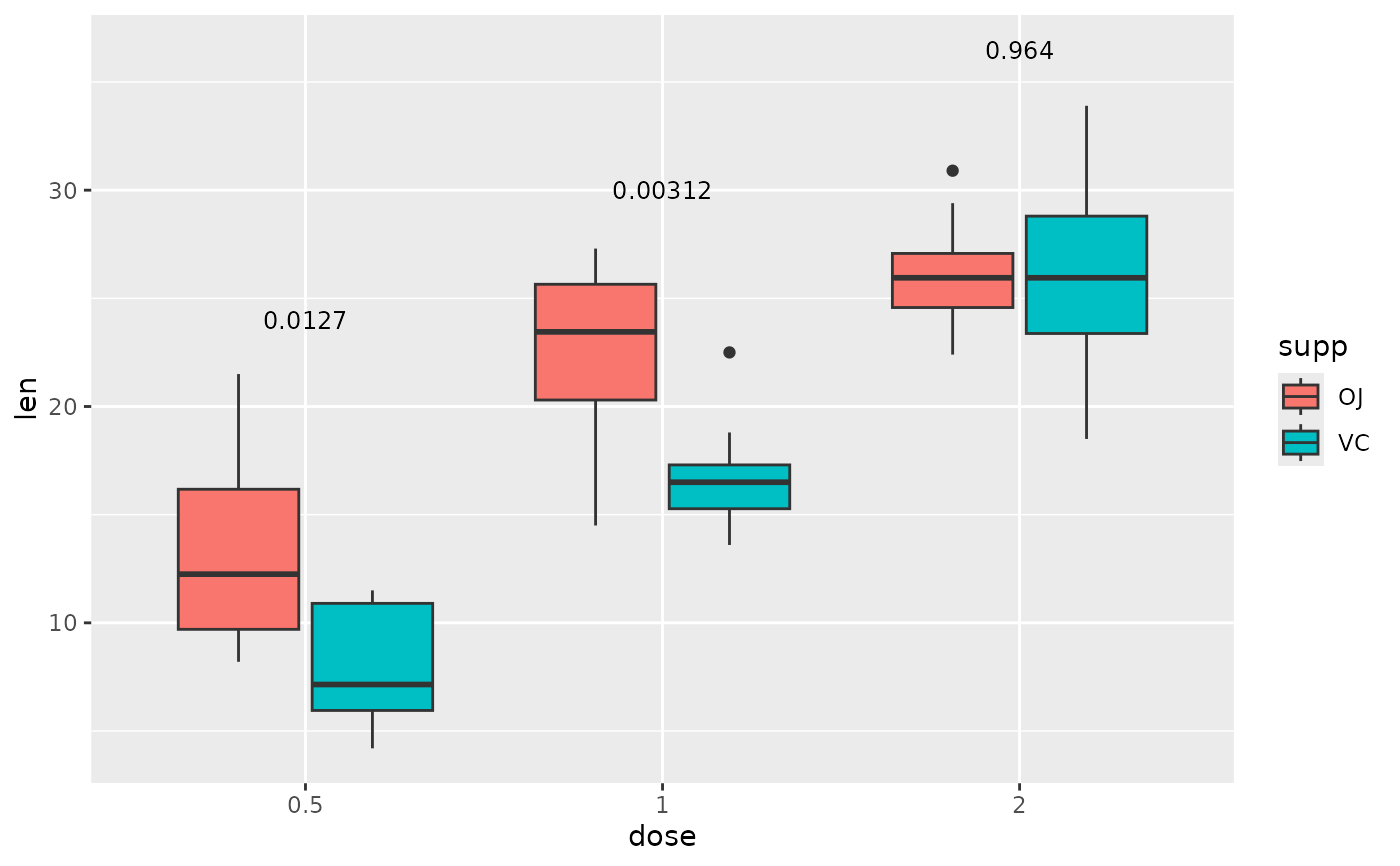
 ## p-value (text only) with a grouping variable
two.means.grouped1 <- tibble::tribble(
~group1, ~group2, ~p.adj, ~y.position, ~dose,
"OJ", "VC", 0.0127, 24, "0.5",
"OJ", "VC", 0.00312, 30, "1",
"OJ", "VC", 0.964, 36.5, "2"
)
ggplot(tg, aes(x = dose, y = len)) +
geom_boxplot(aes(fill = supp)) +
add_pvalue(two.means.grouped1, x = "dose")
## p-value (text only) with a grouping variable
two.means.grouped1 <- tibble::tribble(
~group1, ~group2, ~p.adj, ~y.position, ~dose,
"OJ", "VC", 0.0127, 24, "0.5",
"OJ", "VC", 0.00312, 30, "1",
"OJ", "VC", 0.964, 36.5, "2"
)
ggplot(tg, aes(x = dose, y = len)) +
geom_boxplot(aes(fill = supp)) +
add_pvalue(two.means.grouped1, x = "dose")